You shipped an LLM-powered feature. Users love it. Then the invoice arrives. Nobody can explain where $4,000 in API costs went last Tuesday.
LLMs are black boxes in production. You can’t see how many tokens each request burns, which model is slower, or why a batch job at 3 AM quietly retried thousands of failed completions and doubled your daily spend. Traditional APM tools are starting to add LLM support, though coverage and pricing vary; some bundle it in, others charge extra. Dedicated LLM observability platforms offer deeper insight out of the box, though many require a proprietary SDK or proxy that ties your instrumentation to a single vendor.
This guide is for teams that already run Elastic (or are evaluating it) and want to add LLM observability without adopting a separate vendor. If you’re using a different backend, the OpenTelemetry instrumentation still applies. Only the exporter configuration changes.
In this post, I’ll walk you through building a full LLM monitoring stack using open standards: OpenTelemetry, OpenLLMetry, and Elastic APM. By the end, you’ll have cost tracking, latency metrics, error correlation, and multi-model comparison running in Kibana, with vendor-neutral telemetry (OpenTelemetry + OTLP) and a swappable instrumentation layer (OpenLLMetry is one option among several).
1. OpenTelemetry in 60 Seconds
Before we talk about LLMs, let’s ground ourselves in the observability standard that makes all of this possible.
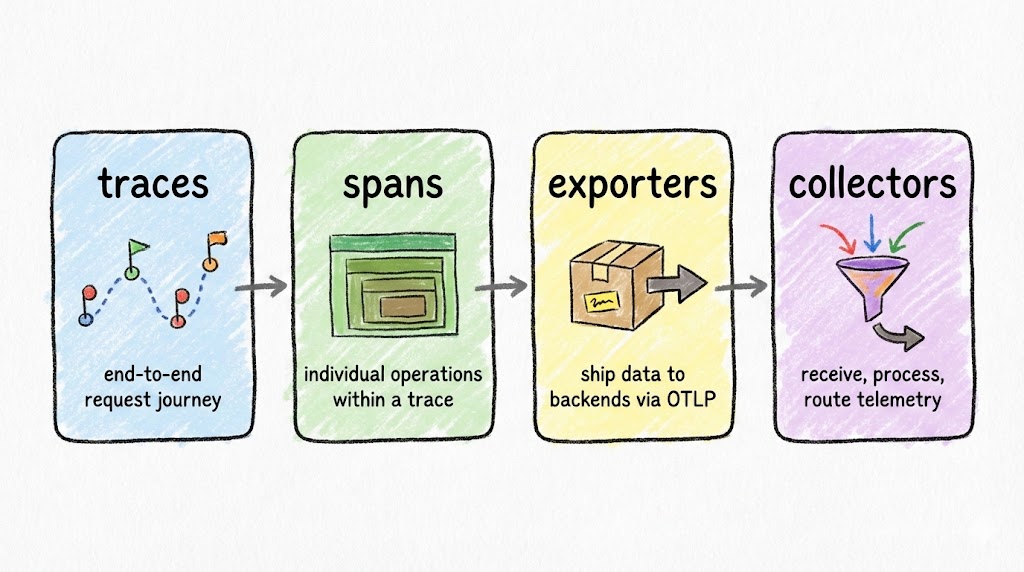
OpenTelemetry (OTel) has four building blocks you need to know:
- Traces capture the full journey of a request through your system, from the HTTP endpoint down to the database query.
- Spans are individual operations within a trace. Each span has a name, duration, status, and arbitrary key-value attributes.
- Exporters ship your trace data out of the application, typically via the OTLP protocol.
- Collectors receive, process, and route telemetry data to your backend of choice (Elastic, Jaeger, Datadog, or anything that speaks OTLP).
Why does OTel matter for LLM apps? Because it’s vendor-neutral and composable. You instrument once and send data anywhere. When your observability needs change (and they will), you swap the backend, not the instrumentation code.
2. Enter OpenLLMetry
OpenTelemetry handles generic telemetry. LLM calls have unique attributes (model names, token counts, prompt content, system identifiers) that standard OTel instrumentation doesn’t capture. That’s where OpenLLMetry comes in.
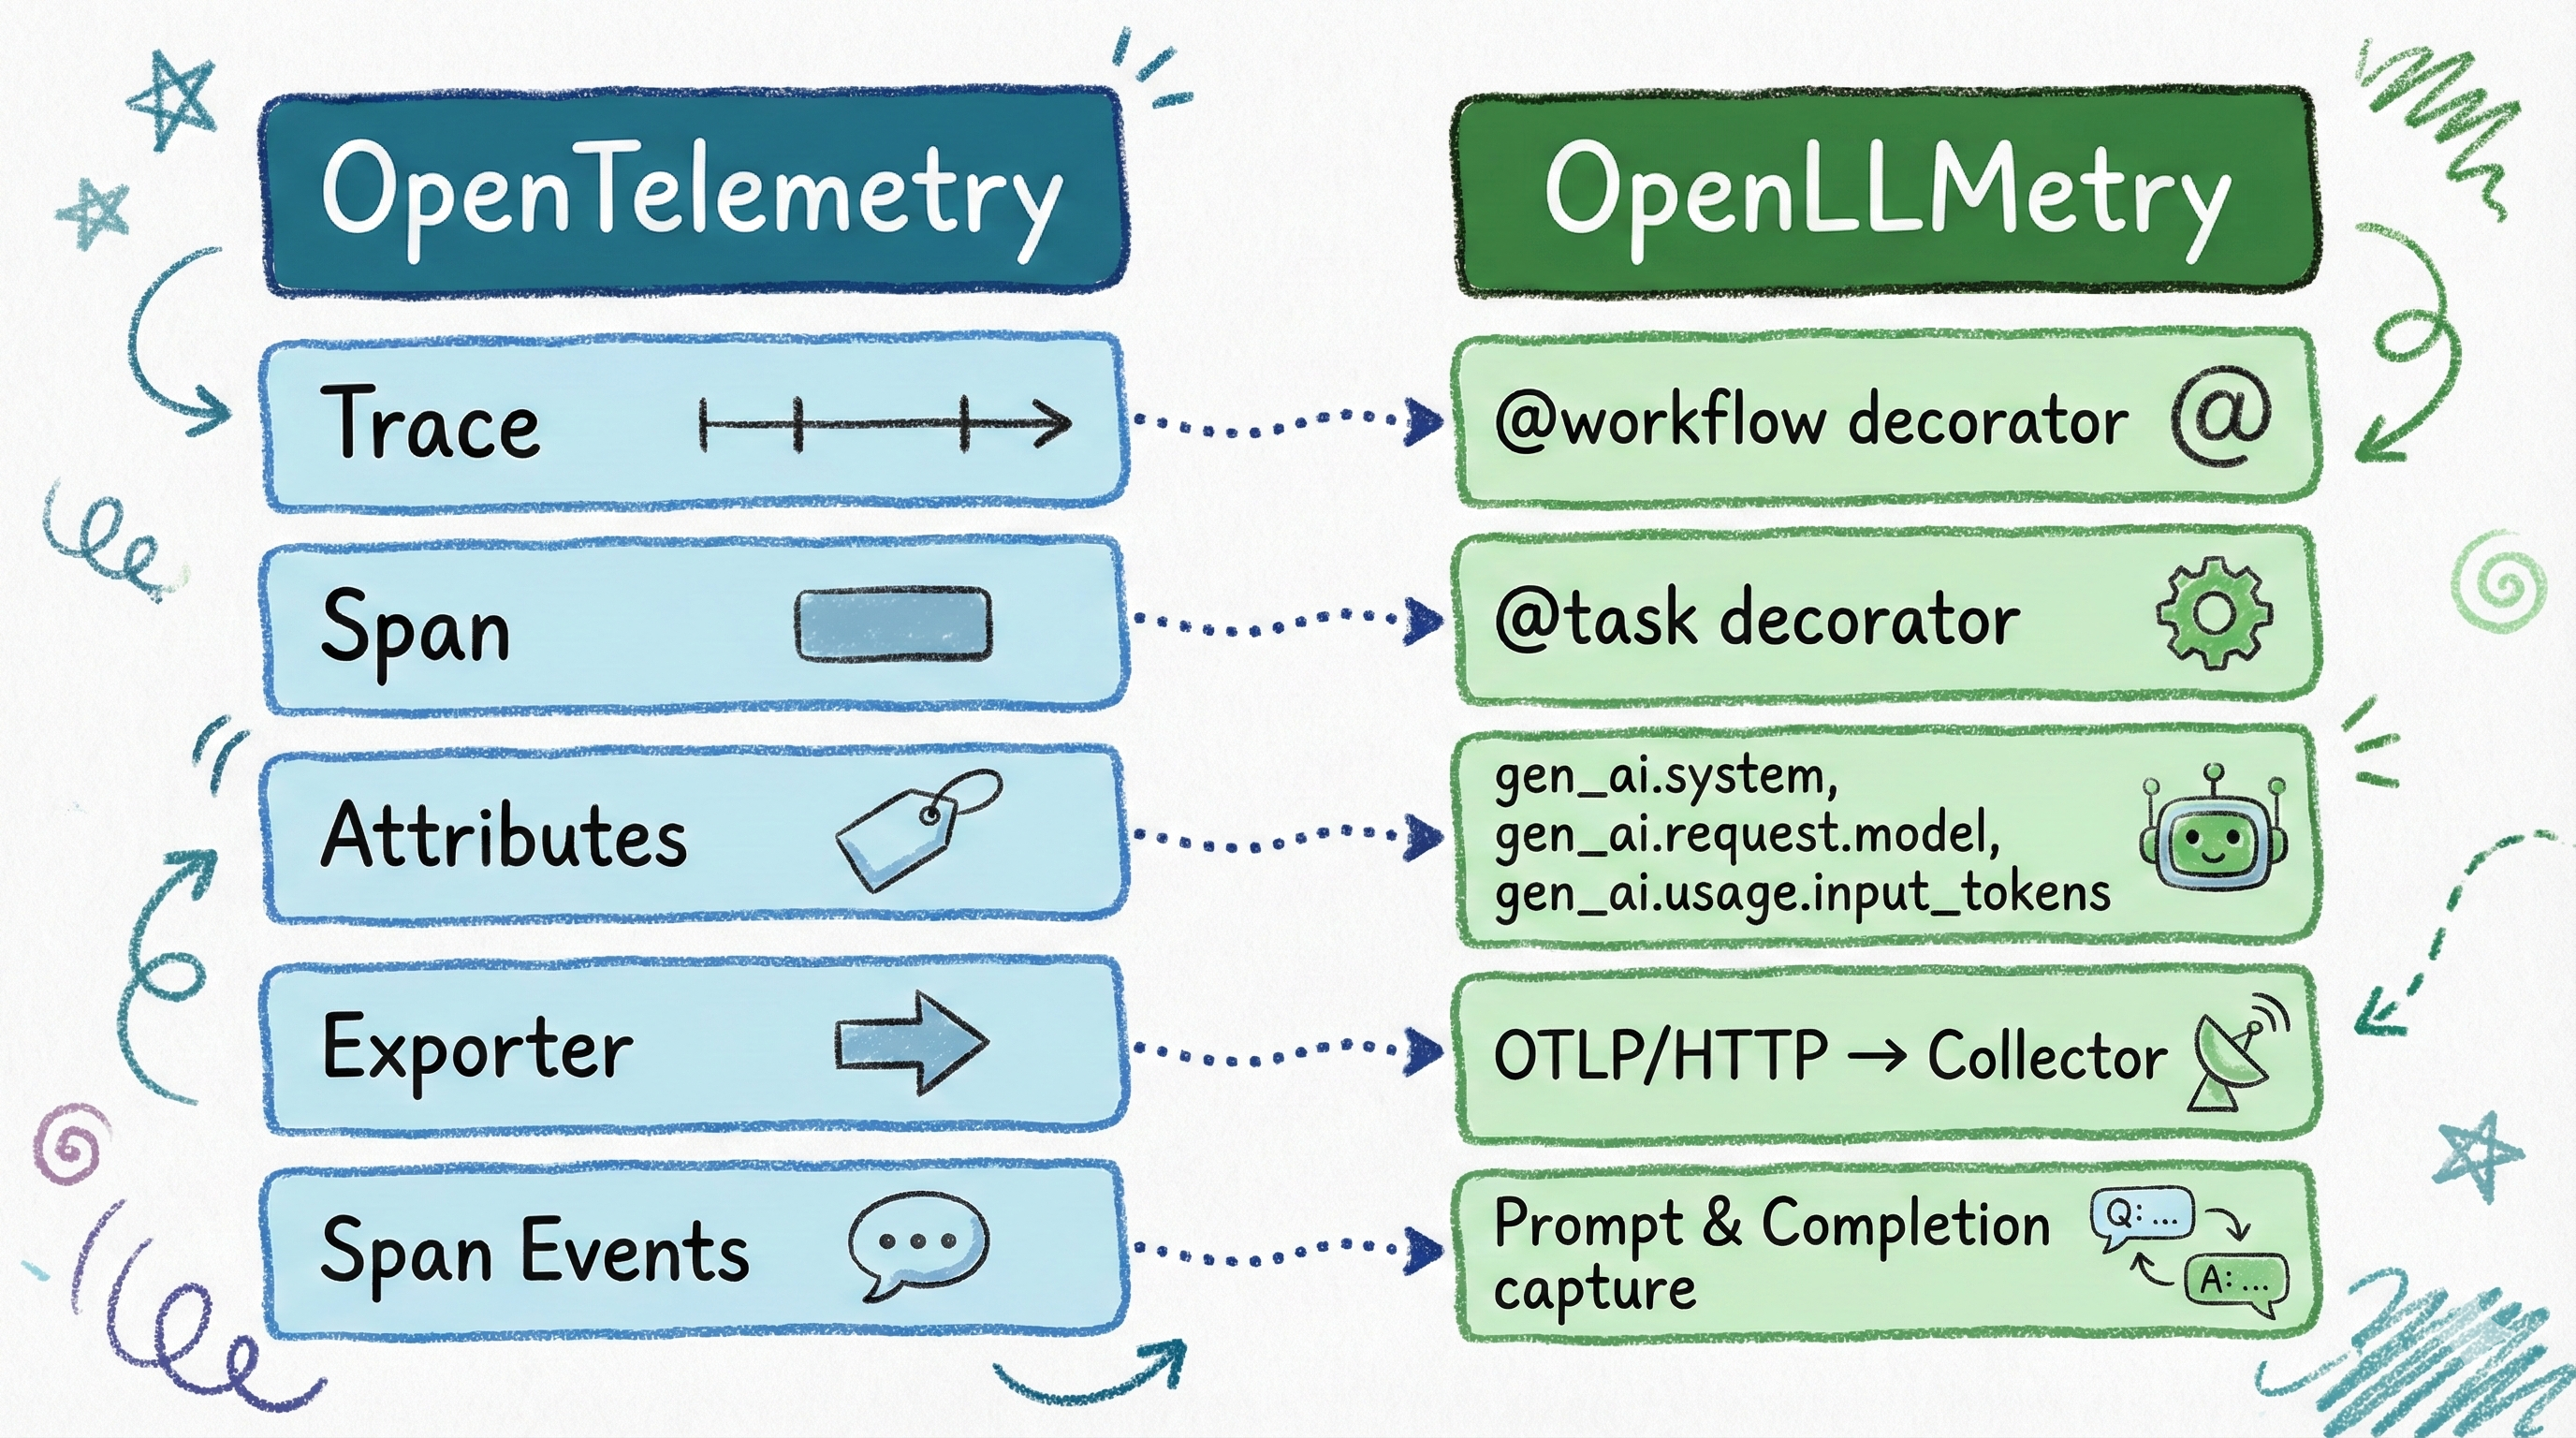
OpenLLMetry is Traceloop’s open-source instrumentation layer built on top of OpenTelemetry. It maps cleanly to OTel’s concepts:
| OTel Concept | OpenLLMetry Equivalent |
|---|---|
| Trace | @workflow decorator |
| Span | @task decorator |
| Attributes | Auto-captured gen_ai.* fields |
| Exporter | Same OTLP exporter — unchanged |
When you decorate a function with @task, OpenLLMetry automatically captures gen_ai.request.model, gen_ai.usage.input_tokens, gen_ai.usage.output_tokens, gen_ai.system, and more. No manual attribute setting required. The @workflow decorator creates a top-level span that groups related @task spans into a single trace hierarchy, giving you end-to-end visibility into multi-step LLM operations.
Some gen_ai.* attribute names are evolving as the semantic conventions mature. Check the latest spec for current names.
3. Before vs After: The Code
Compare LLM instrumentation with raw OpenTelemetry versus OpenLLMetry.
The Hard Way: Manual OpenTelemetry
First, the setup boilerplate. About 10 lines before you write any business logic:
| |
Then, every single LLM call function needs ~25 lines of manual instrumentation:
| |
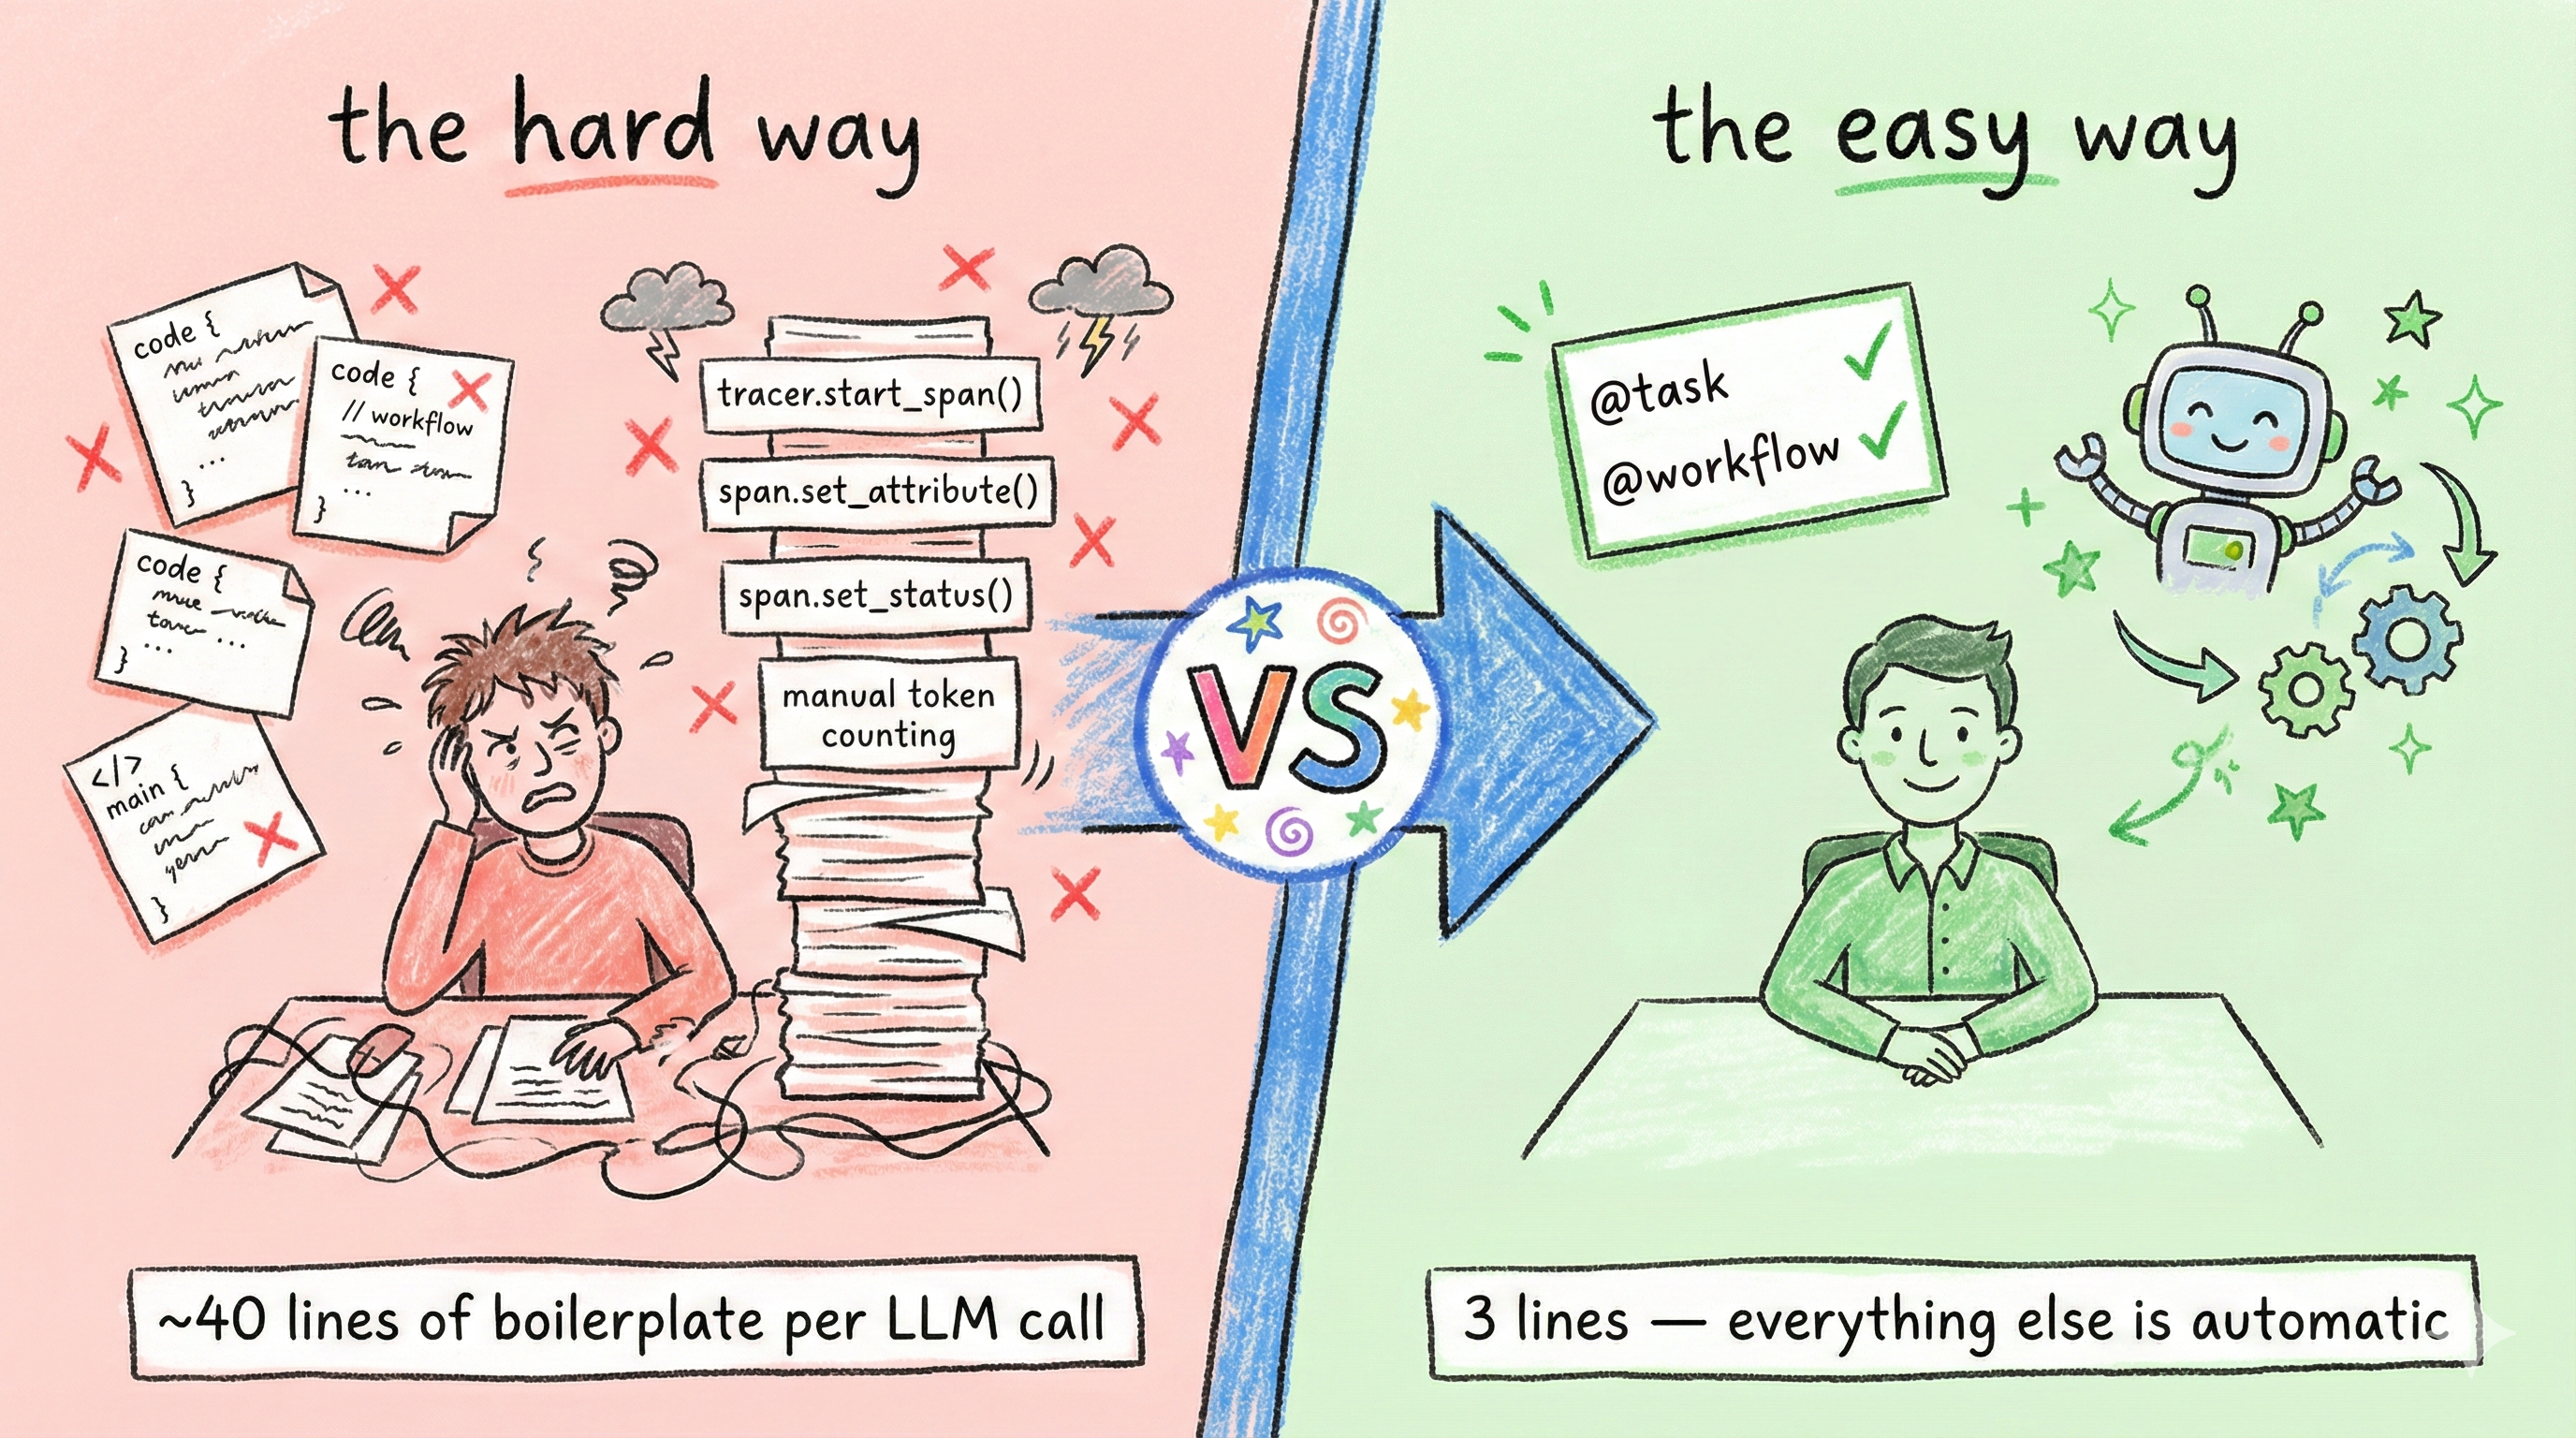
That’s 4 imports, manual provider/processor/exporter wiring, manual span creation, manual attribute setting for every gen_ai field, manual response capture, and manual error handling. Repeat this for every LLM function in your codebase.
The Easy Way: OpenLLMetry
Setup is trivial: two imports, one init call.
| |
Production safety: prompts, PII, and trace size. OpenLLMetry can log prompts and completions into span attributes. Useful for debugging, but also a way to leak sensitive data into your observability backend. Disable content tracing in production unless you explicitly need it:
export TRACELOOP_TRACE_CONTENT=false. With content tracing disabled, OpenLLMetry logs metadata (model name, token counts, latency) without capturing prompts or responses. Don’t log raw customer identifiers (hash them or use a surrogate ID), treat traces as a data store where retention and access control matter, and if you must log content, redact aggressively. See Traceloop’s privacy docs for selective per-workflow controls.
The business logic stays clean. Just add decorators:
| |
The key takeaway: zero manual span or attribute management. OpenLLMetry intercepts the OpenAI and Anthropic client libraries, captures all the gen_ai.* attributes automatically, and your functions contain nothing but business logic.
What about OTel’s own auto-instrumentation? The opentelemetry-instrumentation-openai package also auto-captures gen_ai.* attributes without manual span code. The tradeoff is that it gives you auto-instrumentation for LLM calls but not the @workflow/@task decorator model for grouping business logic into named trace hierarchies. OpenLLMetry adds that layer on top, which is why I chose it for this project. If you only need LLM call telemetry without workflow grouping, the native OTel instrumentation is a lighter option.
4. System Architecture
The full pipeline from your Flask app to a Kibana dashboard.
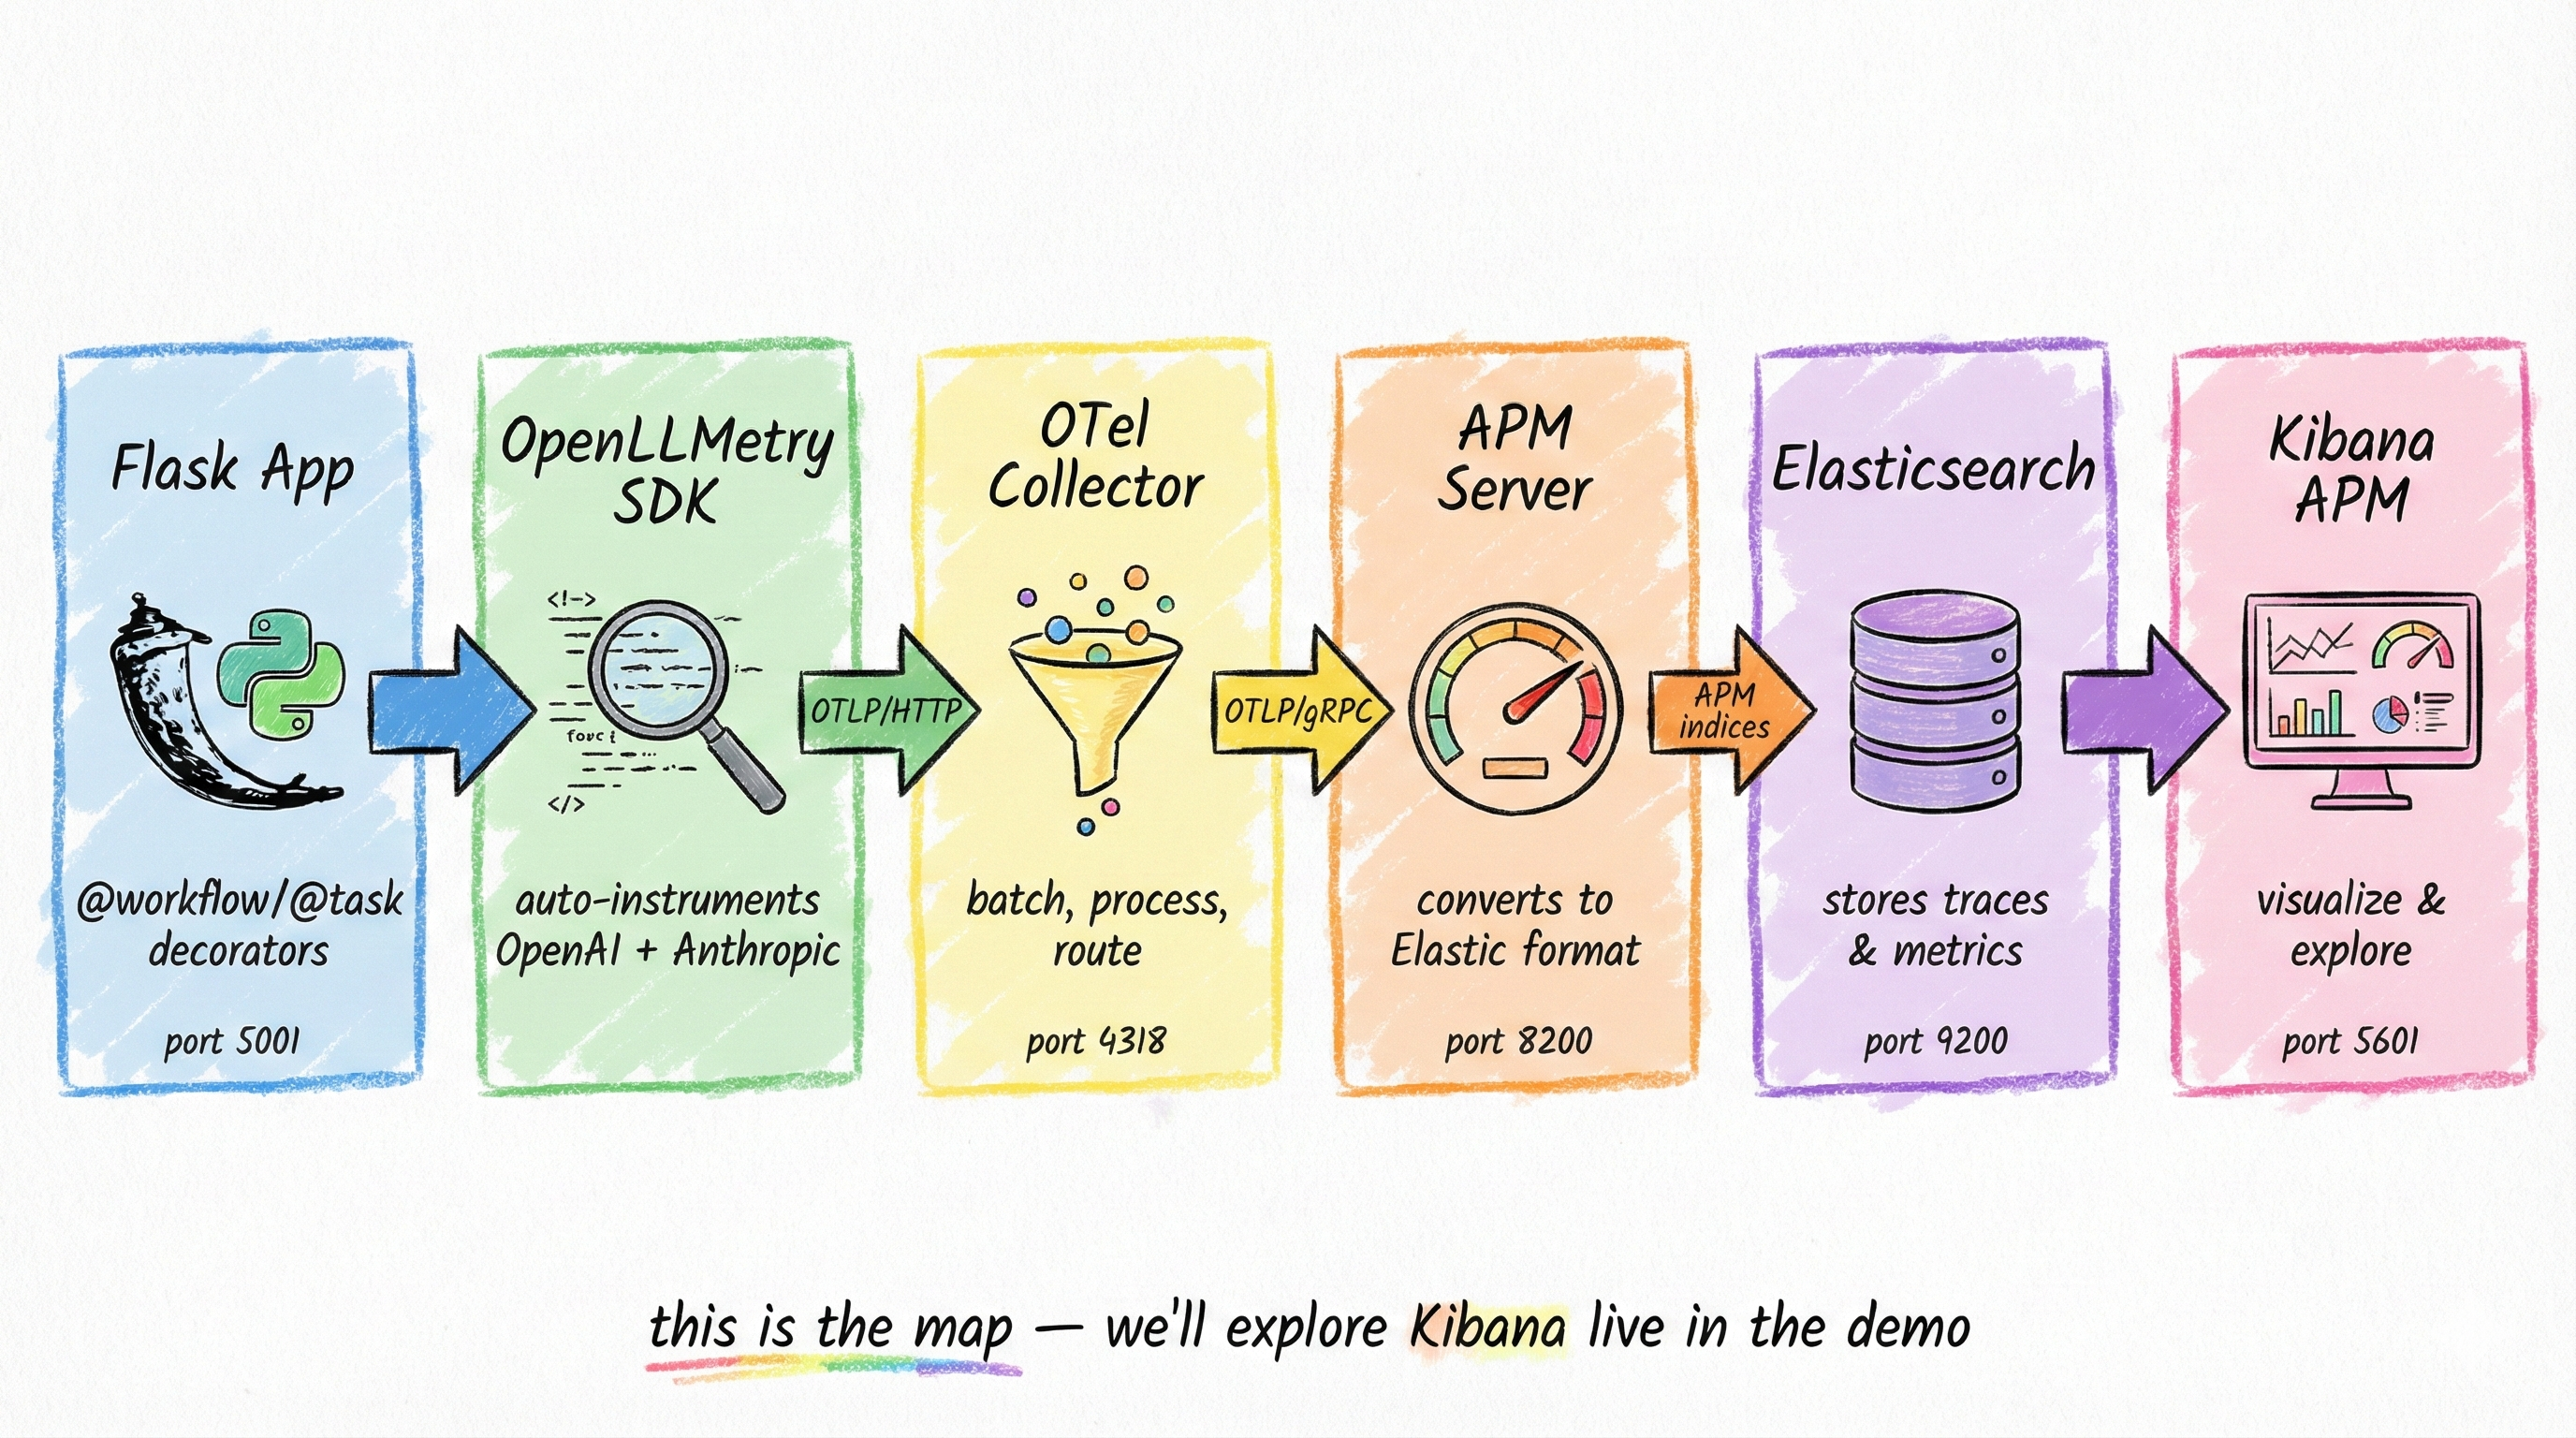
The stack has six components, all running in Docker Compose on a single bridge network:
- Flask App: Your Python application, instrumented with OpenLLMetry decorators.
- OpenLLMetry SDK: Auto-instruments OpenAI and Anthropic client libraries, captures
gen_ai.*attributes, exports via OTLP/HTTP. - OpenTelemetry Collector: Receives OTLP/HTTP on port 4318, batches spans, applies memory limits, and routes to APM Server via OTLP/gRPC.
- APM Server: Natively ingests OTLP trace data and indexes it into Elasticsearch.
- Elasticsearch: Stores all trace data. The
gen_ai.*span attributes land in Elasticsearch aslabels.gen_ai_*(strings) ornumeric_labels.gen_ai_*(numbers), with dots replaced by underscores. - Kibana: Provides the APM UI with service maps, trace waterfalls, and custom dashboards.
Field mapping reality (Elastic APM + OTel): Only a subset of OpenTelemetry attributes are mapped to first-class Elastic fields. Unmapped attributes are stored under
labels.*(strings) ornumeric_labels.*(numbers), with dots replaced by underscores. For example:gen_ai.request.model→labels.gen_ai_request_model,gen_ai.usage.input_tokens→numeric_labels.gen_ai_usage_input_tokens. See Elastic’s OTel attributes docs for the full mapping table.
The data flow is straightforward: your app sends OTLP/HTTP to the Collector, which forwards OTLP/gRPC to APM Server, which writes to Elasticsearch. Kibana reads from Elasticsearch. No custom adapters, no proprietary protocols.
I considered sending OTLP directly from the app to APM Server, skipping the Collector entirely. It works for a single service, but the Collector gives you a buffer for backpressure, a place to add processors later (attribute filtering, sampling), and decouples your app from the backend topology. For anything beyond a demo, it’s worth the extra container.
The Docker Compose overview:
| |
See the full
docker-compose.ymlandotel-collector-config.yamlin the companion repo.
5. Building a Multi-Agent Workflow
The real test for an APM stack is multi-agent systems where multiple models collaborate, run in parallel, retry on failure, and feed each other’s outputs. That’s the scenario I built to put this stack through its paces.
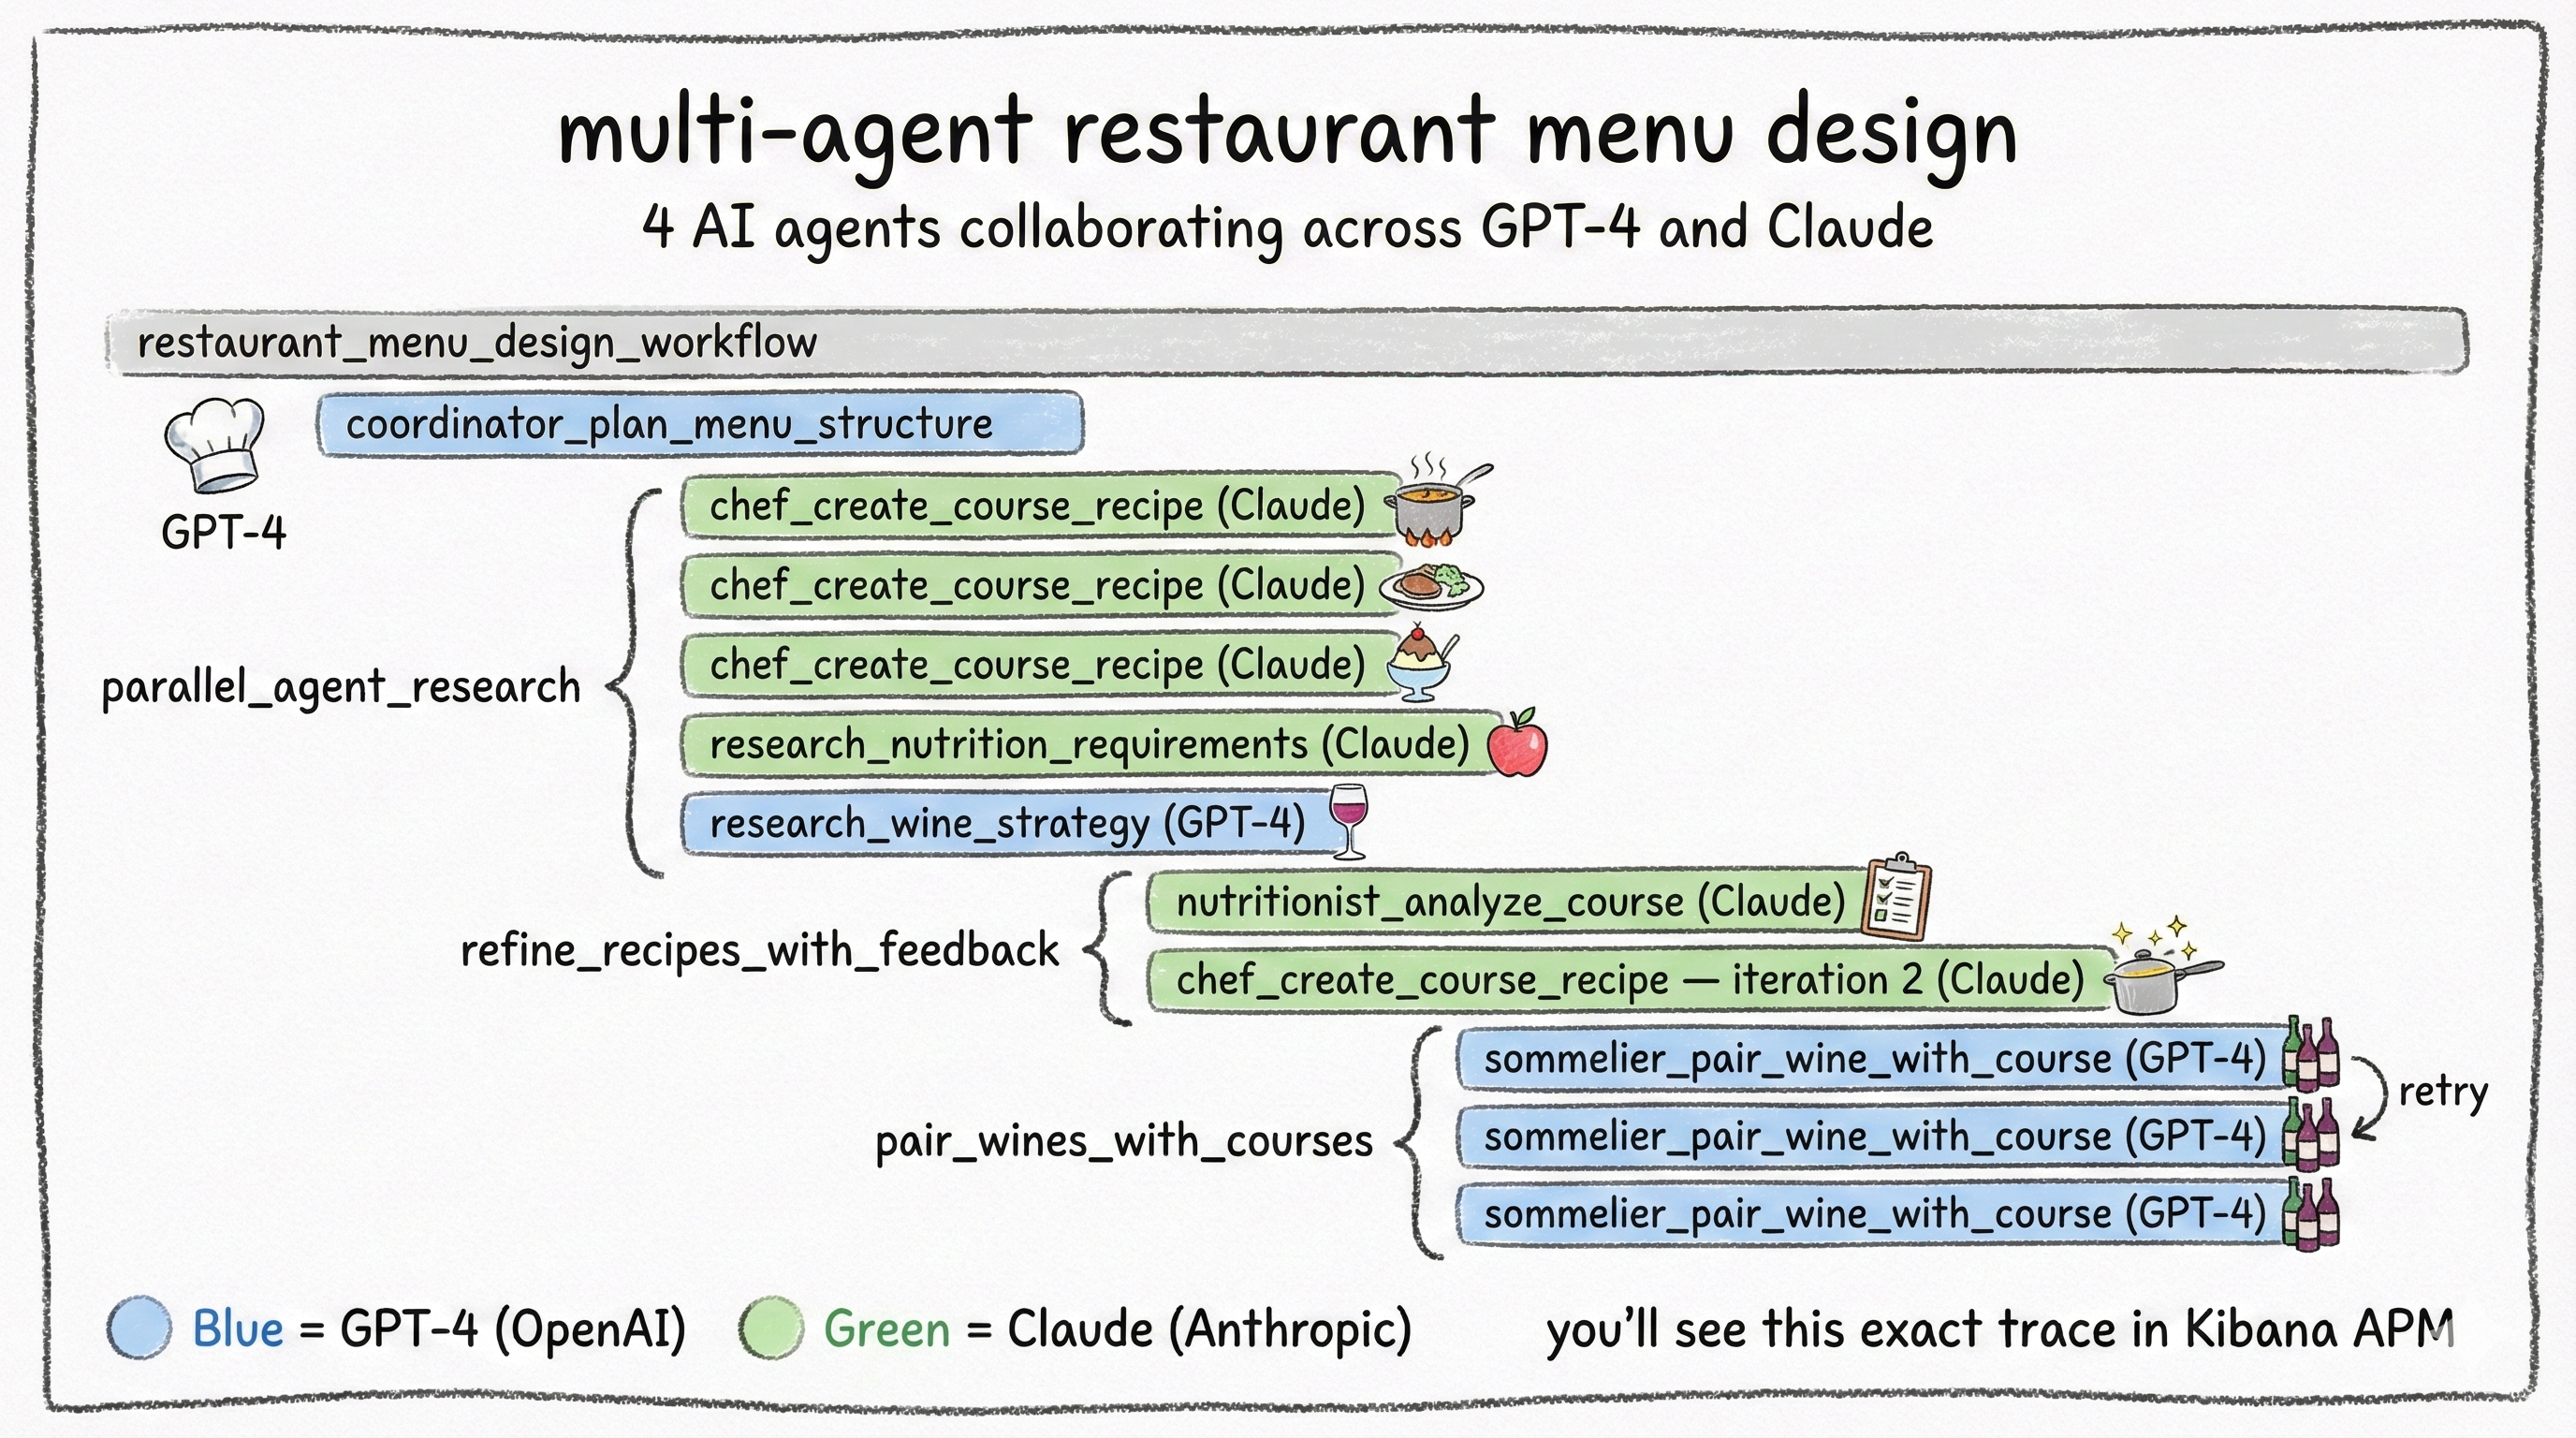
The Restaurant Menu Designer orchestrates 4 AI agents to create a complete fine-dining menu:
| Agent | Model | Role |
|---|---|---|
| Menu Coordinator | GPT (OpenAI) | Strategic planning — designs the course structure |
| Executive Chef | Claude (Anthropic) | Creative — generates detailed recipes for each course |
| Nutritionist | Claude Haiku (Anthropic) | Analytical — reviews nutritional compliance, approves or requests changes |
| Sommelier | GPT (OpenAI) | Expert pairing — matches wines to each course |
The workflow runs in 5 phases:
- Coordinator plans the menu structure (sequential)
- Parallel research: Chef creates recipes, Nutritionist researches dietary guidelines, Sommelier develops a pairing strategy (concurrent via
ThreadPoolExecutor) - Recipe refinement: Nutritionist reviews each recipe, Chef iterates based on feedback (nested workflow with retry logic, max 3 iterations)
- Wine pairing: Sommelier pairs each course (includes automatic retry on incomplete results)
- Final assembly: combine everything into the complete menu
| |
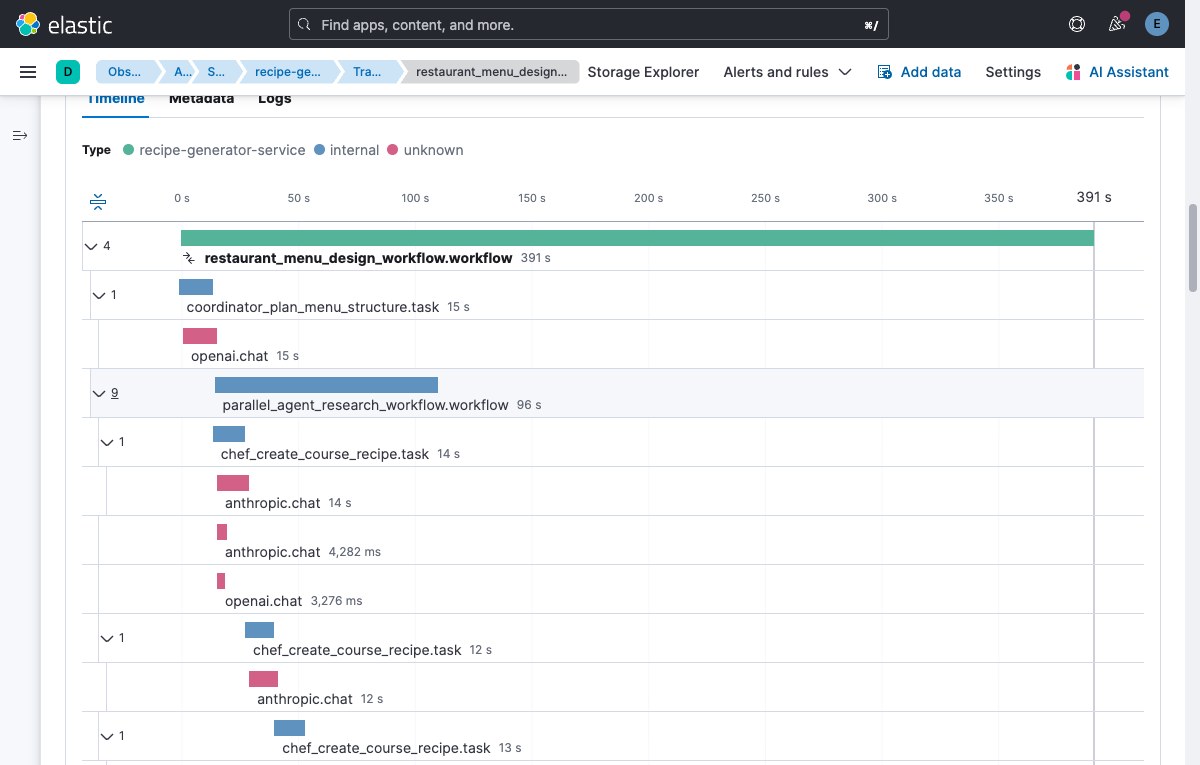
This creates a deeply nested trace with 15-20 spans: parallel execution branches, cross-model calls (GPT for planning, Claude for creativity), retry attempts visible as iteration counters, and the full agent-to-agent data flow. It’s the perfect stress test for any APM system, and it renders beautifully in Kibana’s waterfall view.
Context propagation across threads is not automatic in Python. If you run tasks in a thread pool, you need threading context propagation so spans created in worker threads remain parented to the originating workflow span.
Traceloop/OpenLLMetry enables OpenTelemetry’s threading context propagation so the active trace context follows work scheduled onto threads. The key idea is propagate context, not “generate extra telemetry.”
If you ever see parallel tasks showing up as separate traces in Kibana, context propagation is the first thing to verify. This was the most time-consuming debugging problem in the entire project. The symptoms are subtle: everything works, traces appear, but parallel tasks show up as orphaned root spans instead of children of the workflow. If you’re seeing that, check context propagation before anything else.
Full implementation:
app/app.py
6. What You Can Monitor
Once traces are flowing into Elastic APM, this is what you get out of the box.
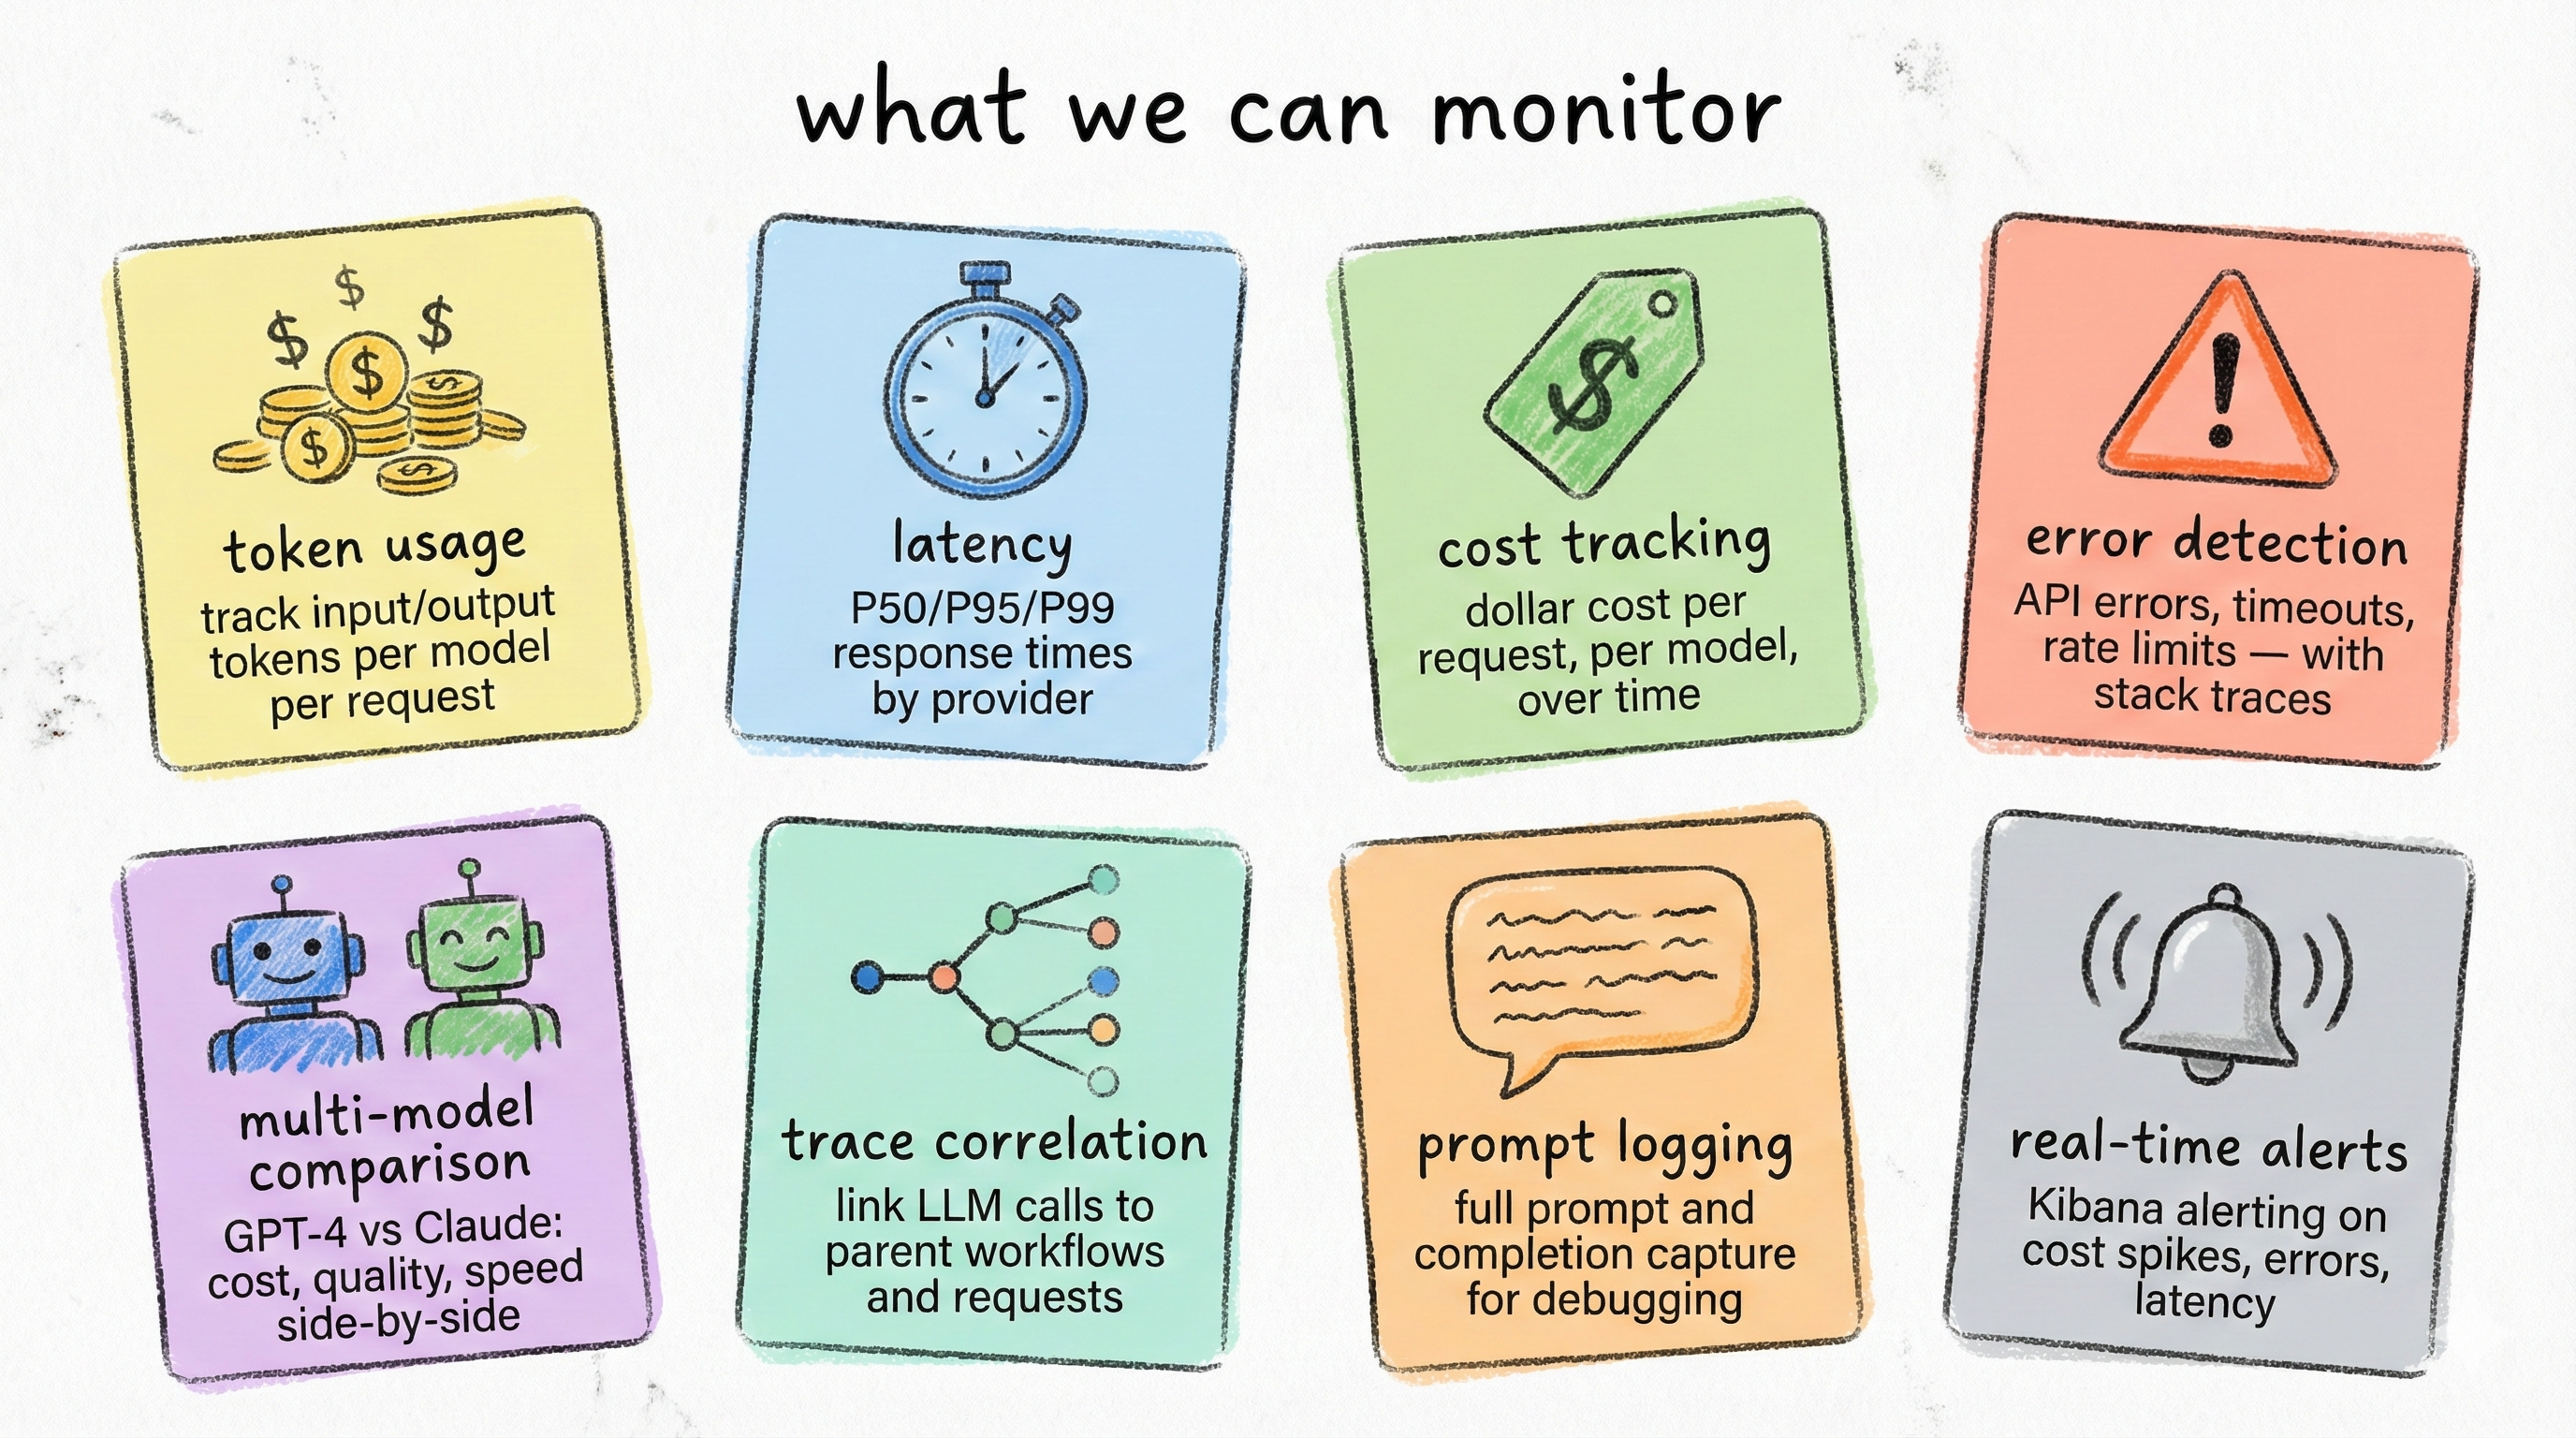
Eight capabilities, each powered by the gen_ai.* attributes that OpenLLMetry captures automatically:
| Capability | What You See | Why It Matters |
|---|---|---|
| Token Usage | Input/output tokens per call, per model | Optimize prompts, catch token inflation |
| Latency | Response time (avg, P95) per model and endpoint | SLA monitoring, provider comparison |
| Cost Tracking | Dollar cost per call, per workflow, per model | Budget control, cost allocation |
| Error Detection | Failed LLM calls with stack traces and retry counts | Reliability monitoring, root cause analysis |
| Multi-Model Comparison | Side-by-side metrics across GPT, Claude, etc. | Informed model selection |
| Trace Correlation | Full request path from HTTP endpoint to LLM call | Debug complex multi-agent workflows |
| Prompt Logging | System/user prompts and completions stored in span attributes | Audit trail, prompt debugging |
| Alerts | Kibana alerting rules on any metric | Token budget alerts, latency spikes, error rate thresholds |
In the Kibana APM UI, you can explore these through the service map (see your app’s dependencies on LLM providers), trace waterfall (drill into individual requests), and span metadata (inspect every gen_ai.* attribute on each LLM call).
Sampling warning: If you sample traces (e.g., 10%), dashboards built from trace data will underestimate tokens and cost unless you compensate. For cost governance, prefer always-on LLM spans or emit token/cost counters as separate OTel metrics alongside traces.
A note on streaming: The examples in this post use non-streaming completions. OpenLLMetry supports streaming, but the behavior differs. Token counts are accumulated incrementally and the span closes when the stream finishes, which can affect latency measurements. If your app streams responses, verify instrumentation behavior with your specific provider SDK version before relying on the metrics.
Traces vs. metrics for cost tracking. This post uses trace-based cost attribution, which gives you per-request granularity. At scale, you may also want to emit OTel metrics (e.g., a gen_ai.cost.total_usd counter and a gen_ai.latency histogram) alongside traces. Metrics are pre-aggregated, cheaper to store, and aren’t affected by trace sampling. A common production pattern is: always-on metrics for dashboards and alerts, sampled traces for debugging specific requests.
7. The Dashboard
All of this data is great in the APM trace view, but for day-to-day monitoring you want a dashboard. I built an 8-panel Kibana Lens dashboard that gives you the full LLM observability picture at a glance.
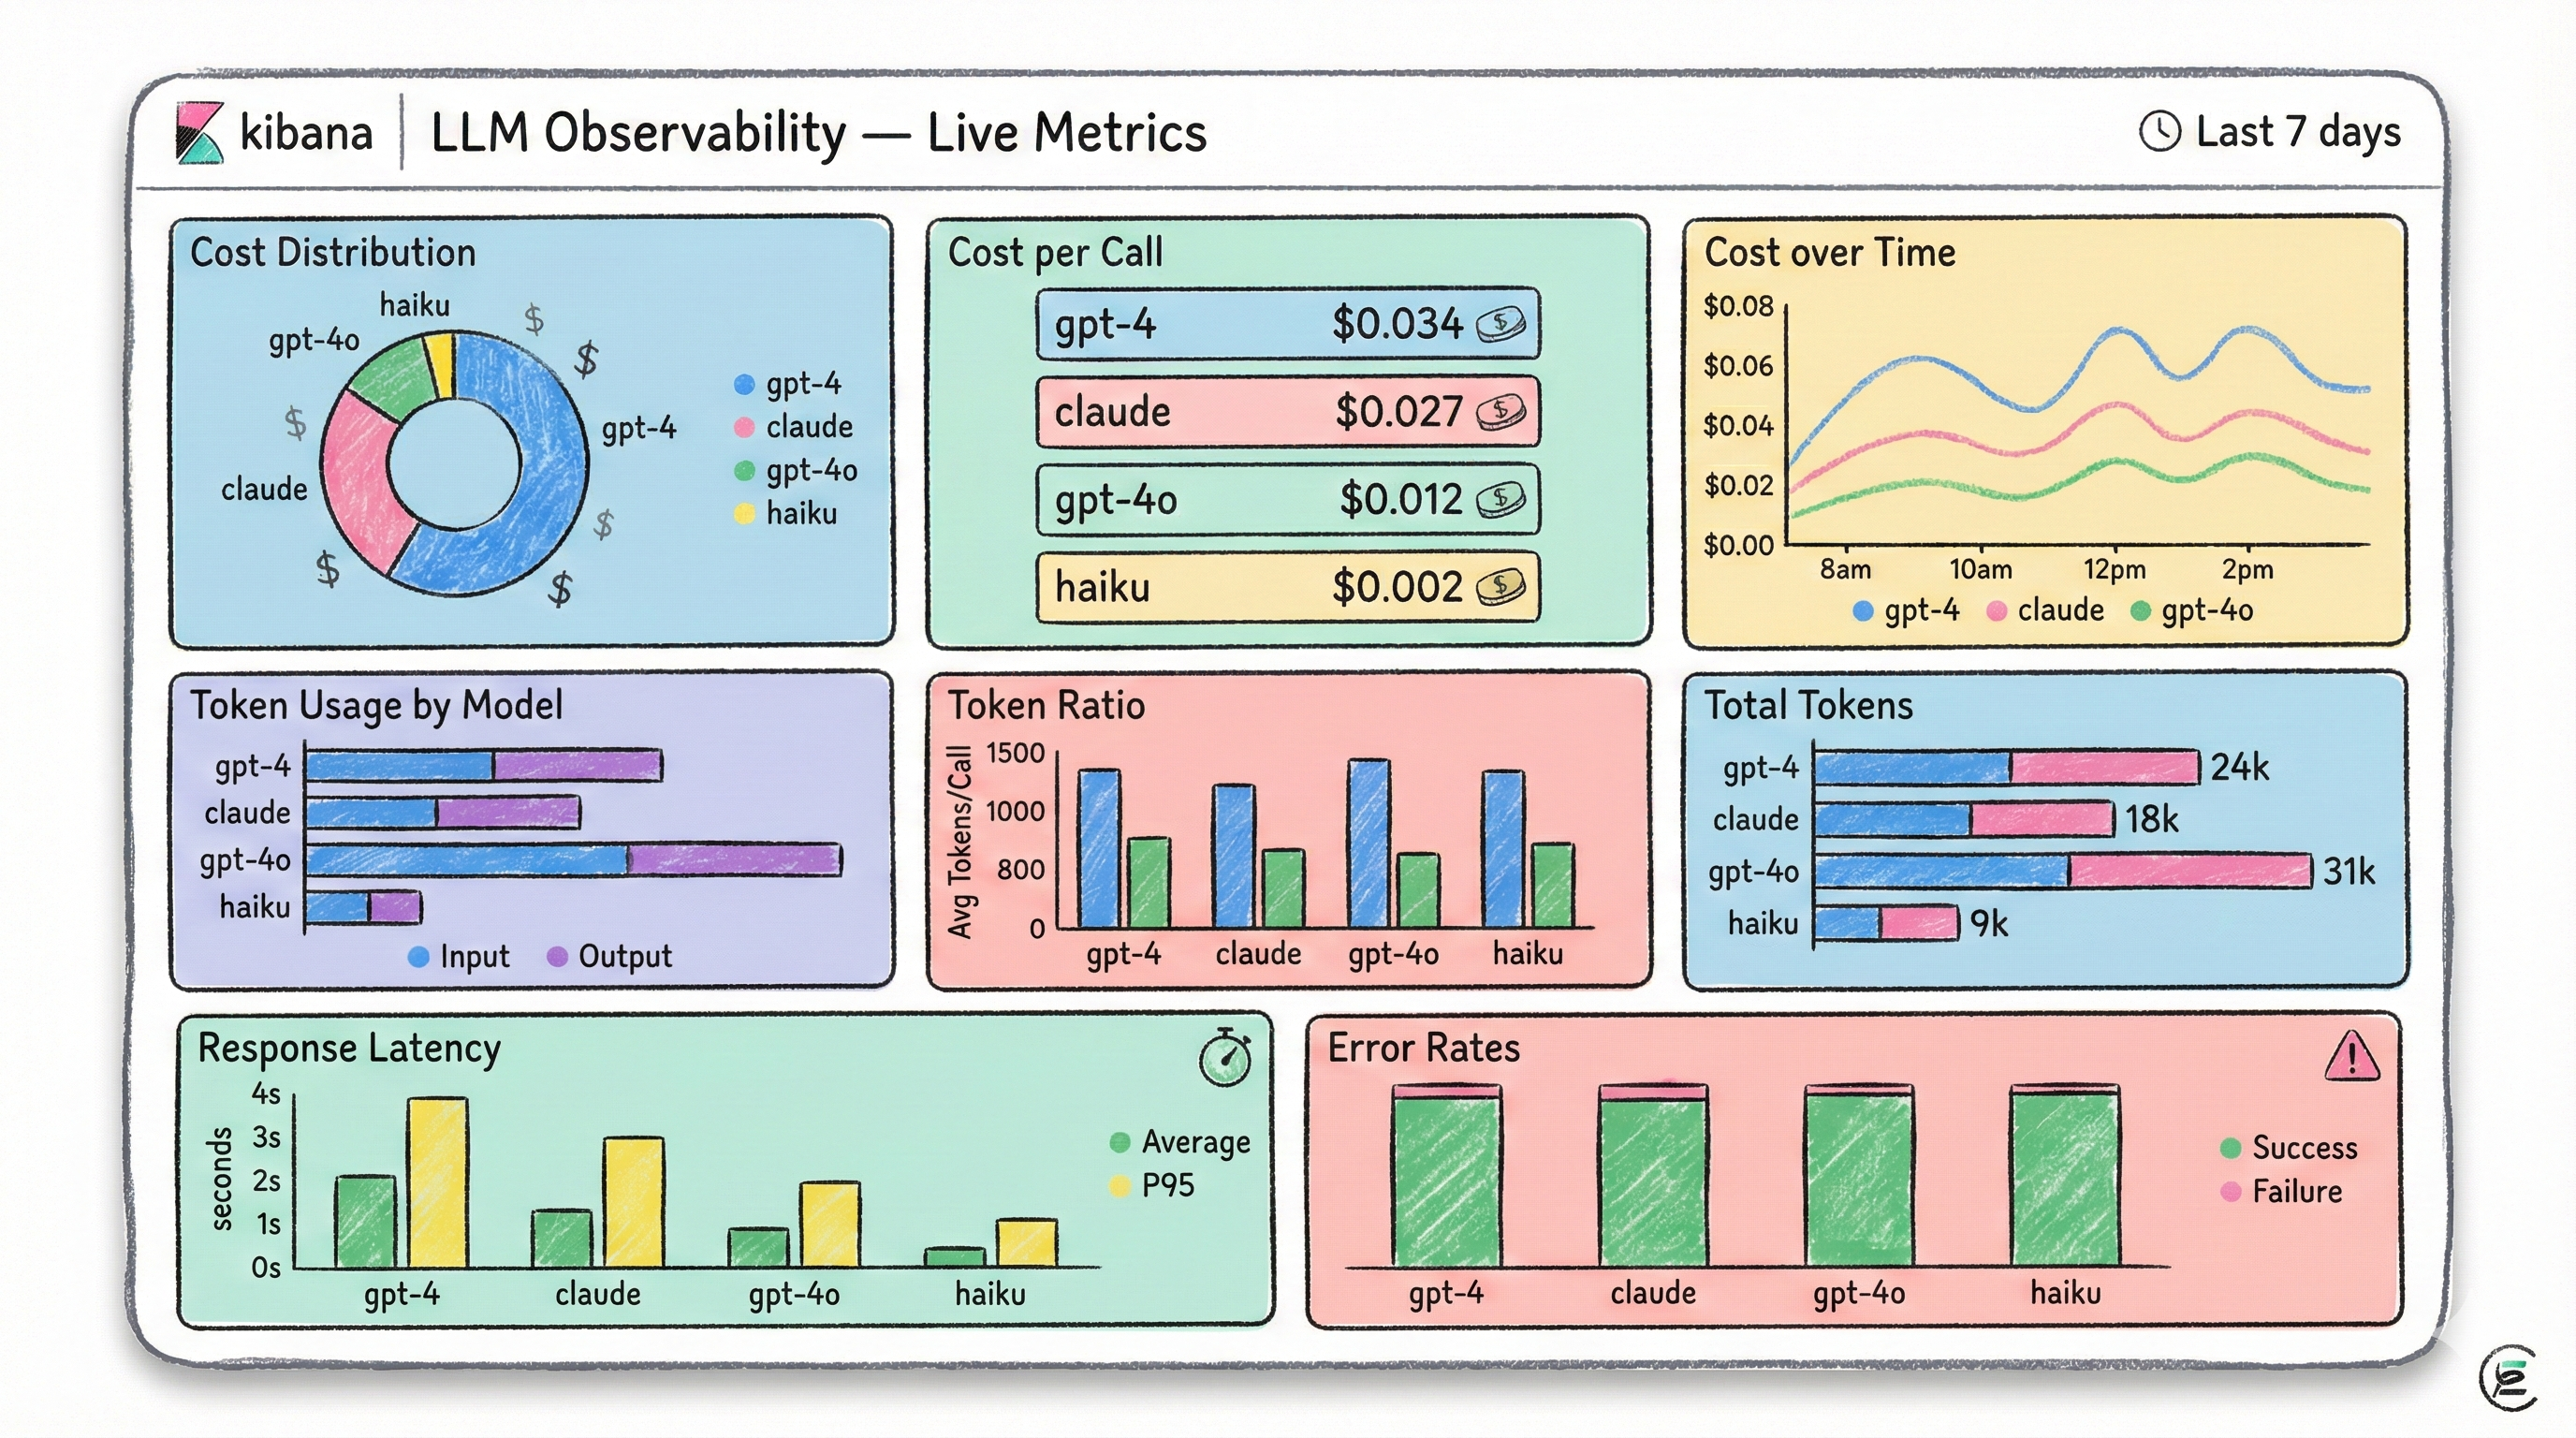
The dashboard is organized in three rows:
Row 1, Cost Analysis:
- Cost Distribution by Model: Donut chart showing what percentage of your total spend goes to each model
- Cost per Call by Model: Metric tiles showing average cost per LLM call (e.g., GPT-4 $0.025 vs Claude $0.012)
- Cost over Time: Line chart tracking spending trends per model
Row 2, Token Usage:
- Token Usage by Model: Stacked bar showing total input + output tokens per model
- Input vs Output Token Ratio: Average input vs output tokens per call. Helps you spot verbose prompts.
- Total Tokens by Model: Compare with cost distribution to identify the most token-efficient models
Row 3, Latency & Reliability:
- Response Latency by Model: Average and P95 latency per model (sourced from
span.duration.us) - Error Rates by Model: Success vs failure outcomes per model
The dashboard is defined as Kibana saved objects in NDJSON format. To import it:
| |
Dashboard definition and setup script:
kibana/
How to build or modify panels (field names that matter)
Because unmapped OTel attributes land under labels.* (strings) or numeric_labels.* (numbers), your token/cost fields will look like:
numeric_labels.gen_ai_usage_input_tokensnumeric_labels.gen_ai_usage_output_tokensnumeric_labels.gen_ai_cost_total_usdlabels.gen_ai_request_model(orlabels.gen_ai_response_model)
Elastic stores span duration as span.duration.us.
Example Lens formulas:
- Total tokens =
sum(numeric_labels.gen_ai_usage_input_tokens)+sum(numeric_labels.gen_ai_usage_output_tokens) - Avg cost per call =
sum(numeric_labels.gen_ai_cost_total_usd)/count() - P95 latency =
percentile(span.duration.us, 95)
If your field names differ, open any LLM span in APM -> Metadata and copy the exact field names from there.
8. Going Further: Automatic Cost Tracking
The gap that motivated the most interesting piece of engineering in this project: OpenLLMetry captures tokens but not dollar cost. It knows you used 500 input tokens and 1200 output tokens on claude-sonnet-4-5-20250929, but it doesn’t know what that costs.
The Architecture
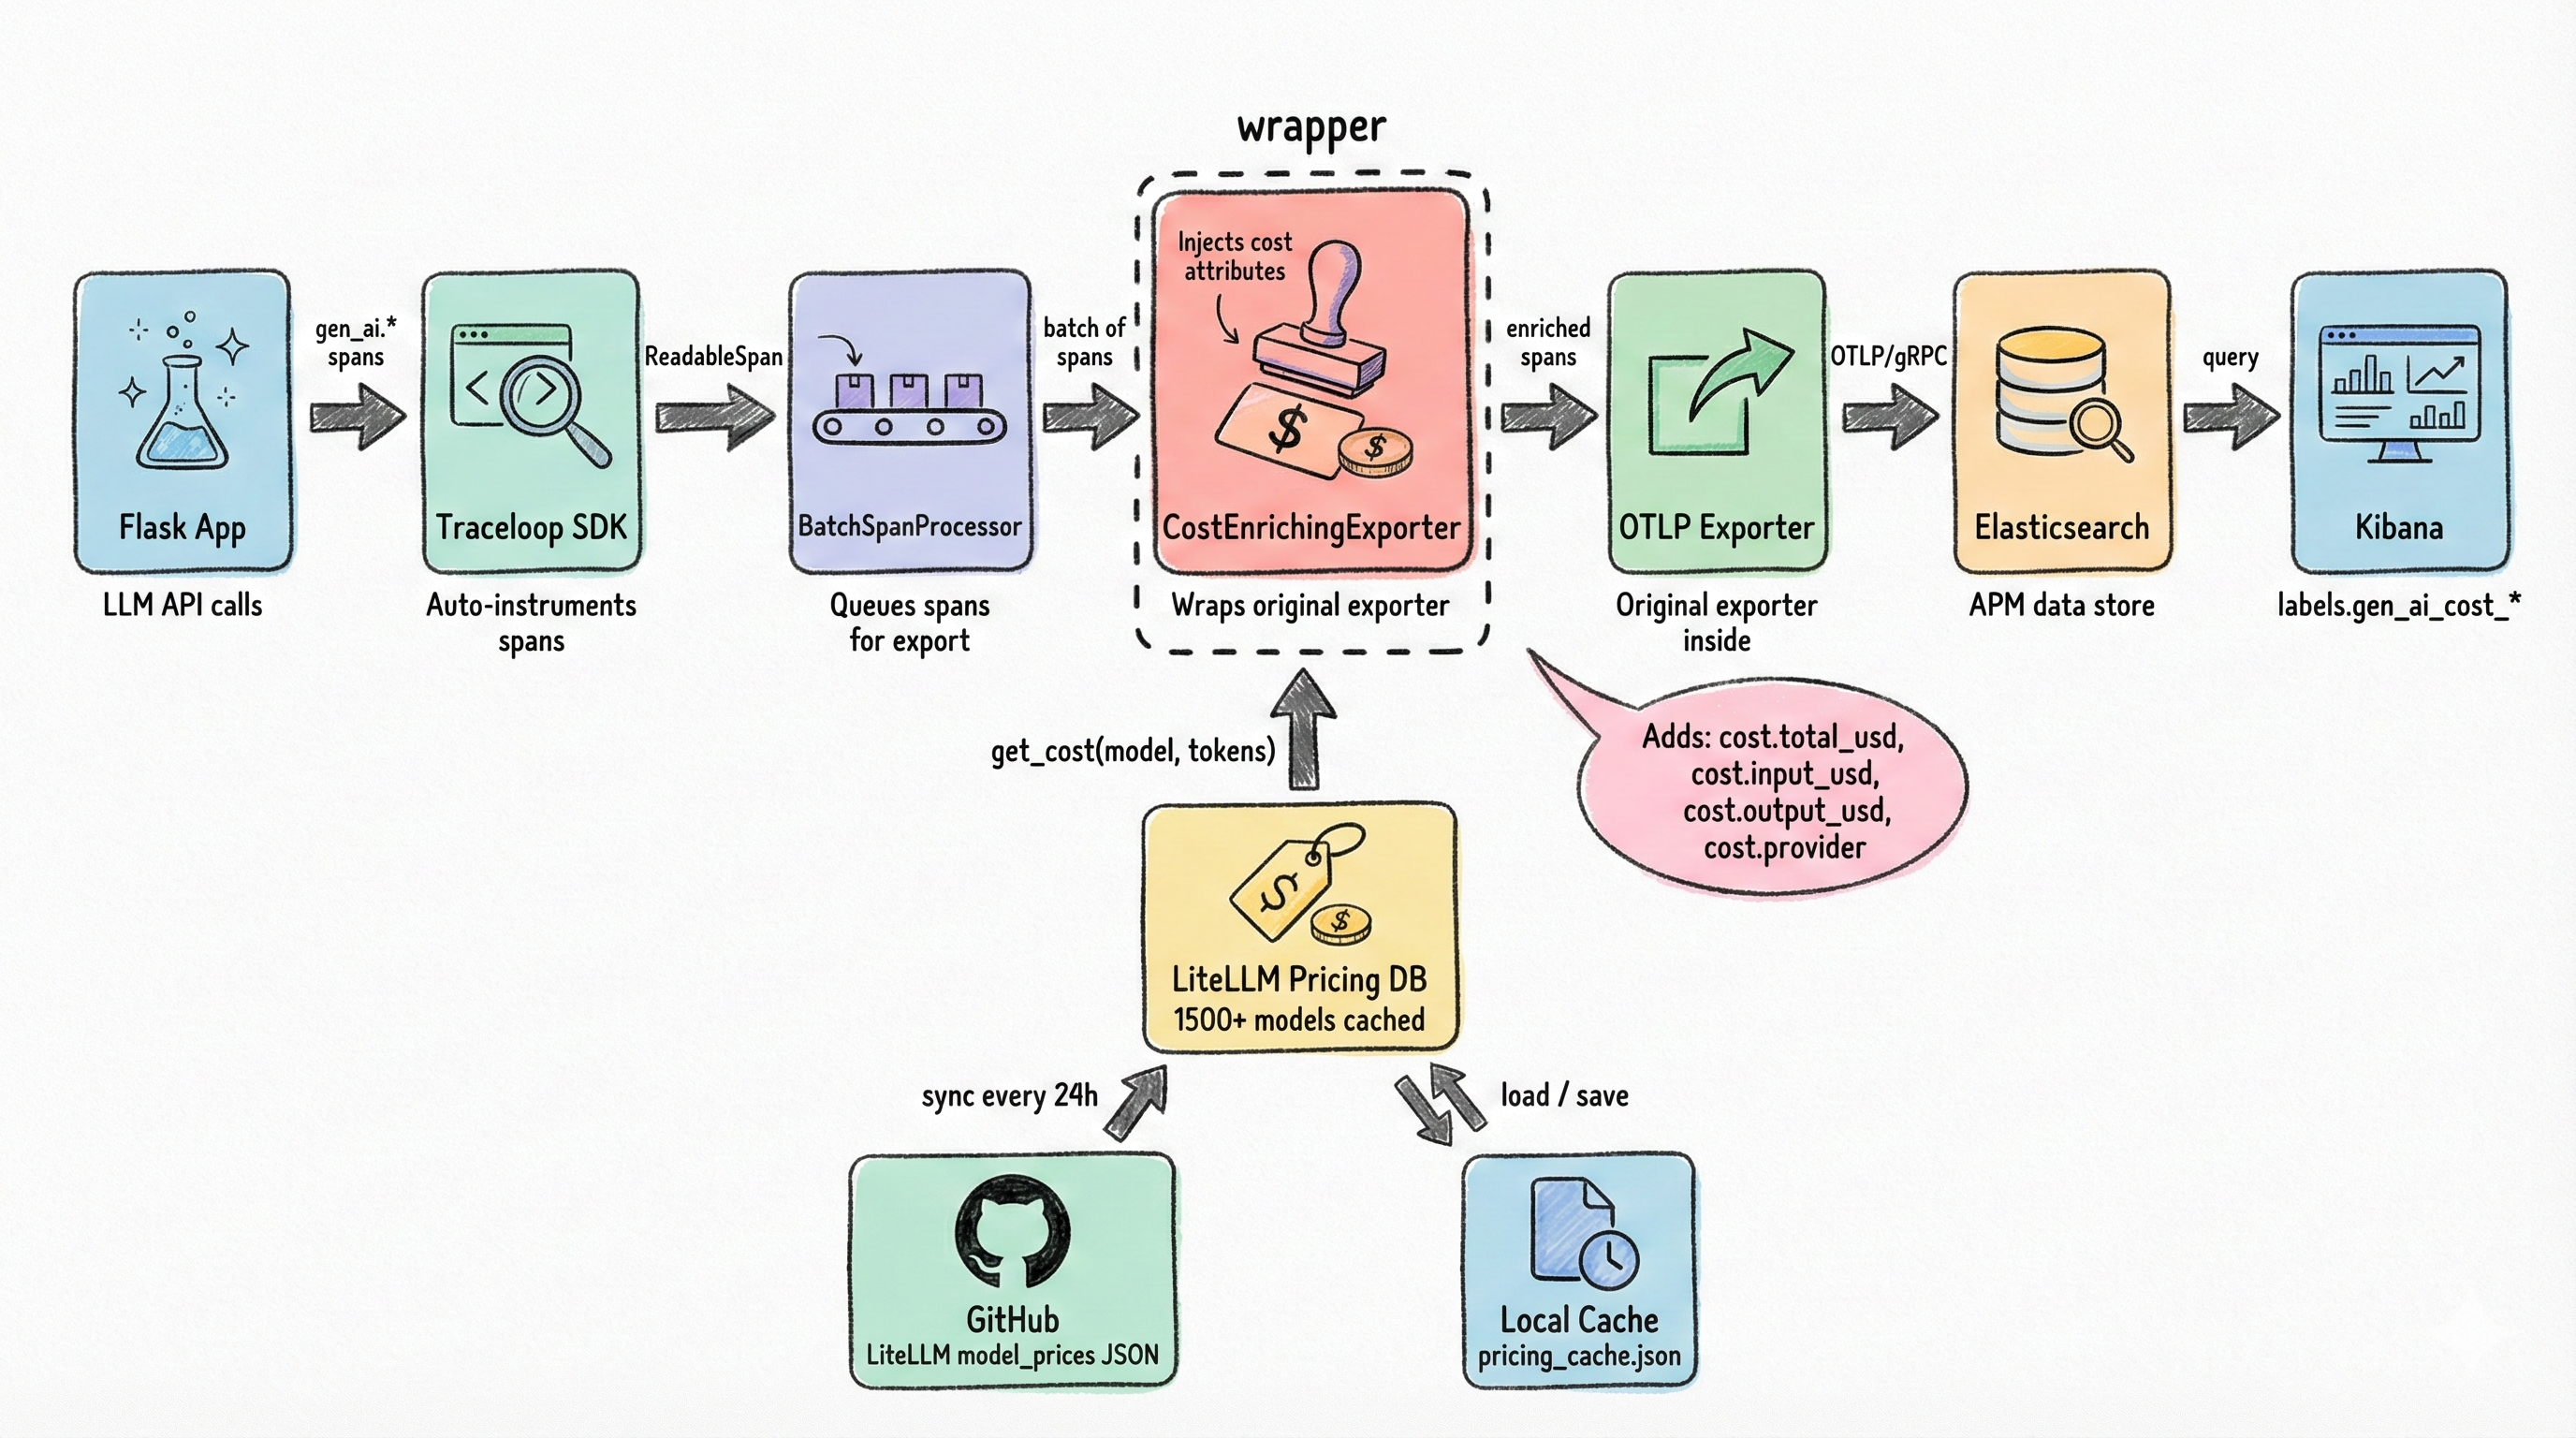
The solution is a custom CostEnrichingSpanExporter that wraps the real OTLP exporter, intercepting the export pipeline to inject cost attributes into LLM spans before they’re sent to the backend. It works by mutating span._attributes in-place, not a public API and therefore upgrade-fragile. I’m using it here to keep the demo small; for production, prefer emitting token/cost metrics via a separate OTel meter or enriching attributes before spans become read-only. If you do use this approach, pin your opentelemetry-sdk version and test after upgrades.
How It Works
The CostEnrichingSpanExporter implements the SpanExporter interface and wraps the original exporter:
| |
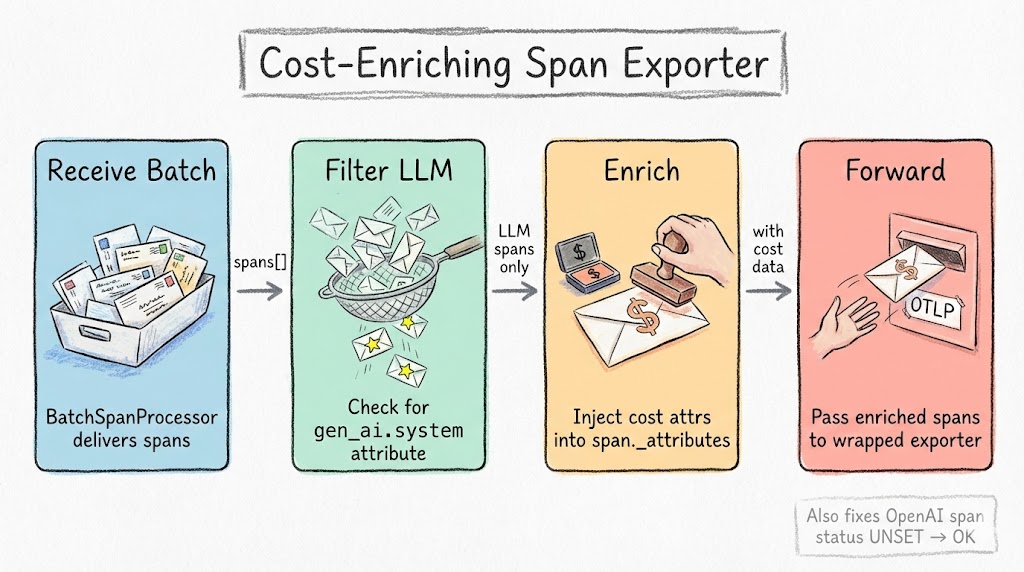
When export() is called by the BatchSpanProcessor, the wrapper:
- Filters for LLM spans (those with
gen_ai.systemattribute) - Extracts model name and token counts from existing span attributes
- Looks up per-token pricing from the database
- Calculates
gen_ai.cost.input_usd,gen_ai.cost.output_usd, andgen_ai.cost.total_usd - Injects the cost attributes into the span
- Forwards everything to the wrapped exporter
Non-LLM spans pass through untouched. Negligible overhead.
Cost math vs invoice reality: Token-based estimates can differ from provider billing due to system prompts, tool calls, cached tokens, rounding, tiered pricing, or provider-side adjustments. Treat this as an allocation and monitoring signal, not a perfect invoice replica.
Production alternative (OTel SpanProcessor): Instead of mutating read-only spans in the exporter, inject cost at span creation via a custom
SpanProcessor. Theon_endhook receives writable spans:
1 2 3 4 5 6 7 8 9 10 11class CostEnrichingSpanProcessor(SpanProcessor): def on_end(self, span: ReadableSpan) -> None: if 'gen_ai.system' in span.attributes: cost = self.pricing_db.get_cost( span.attributes.get('gen_ai.response.model'), span.attributes.get('gen_ai.usage.input_tokens', 0), span.attributes.get('gen_ai.usage.output_tokens', 0), ) self.cost_counter.add(cost['gen_ai.cost.total_usd'], { 'model': span.attributes.get('gen_ai.response.model', 'unknown') })This avoids private API dependencies and works with any OTel backend. The demo repo uses the exporter approach for simplicity. See
app/llm_cost_injector.pyfor the full implementation.
The Pricing Database
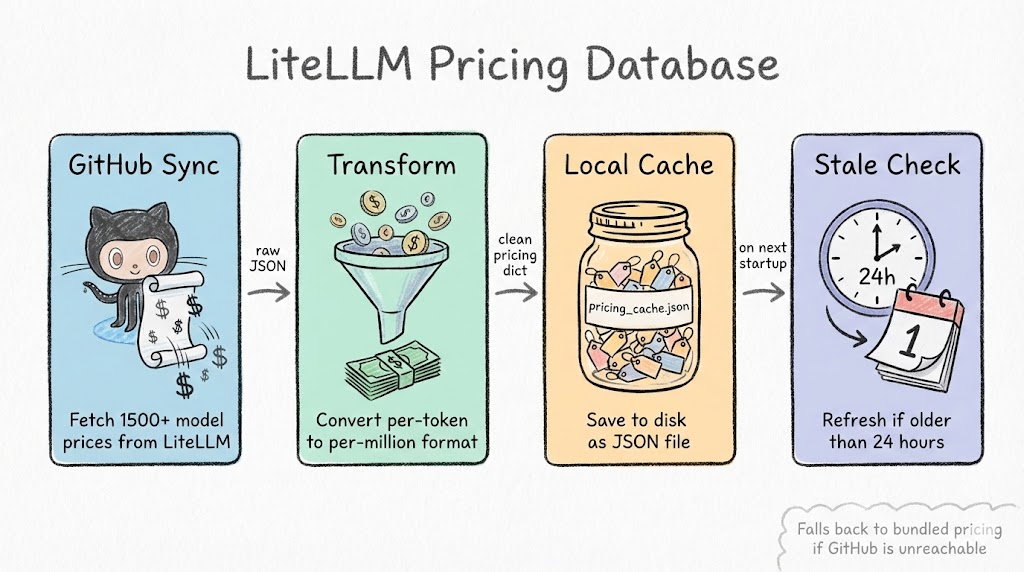
Where do we get pricing data for hundreds of models? From LiteLLM’s open-source pricing database. It’s a JSON file on GitHub with per-token pricing for every major provider: OpenAI, Anthropic, Google, Mistral, Cohere, and more.
The LiteLLMPricingDatabase class:
- Syncs from GitHub on first startup
- Caches locally to avoid network calls on subsequent starts
- Auto-refreshes when the cache is older than 24 hours
- Fuzzy matches model names:
gpt-4o-2024-08-06resolves togpt-4o, provider prefixes likeopenai/gpt-4oare stripped automatically
I initially considered maintaining my own pricing JSON, but model pricing changes frequently enough that it would be stale within weeks. LiteLLM’s database is community-maintained and covers providers I haven’t even tested yet. The tradeoff is a GitHub dependency at startup, which the local caching mitigates.
Wiring It Up
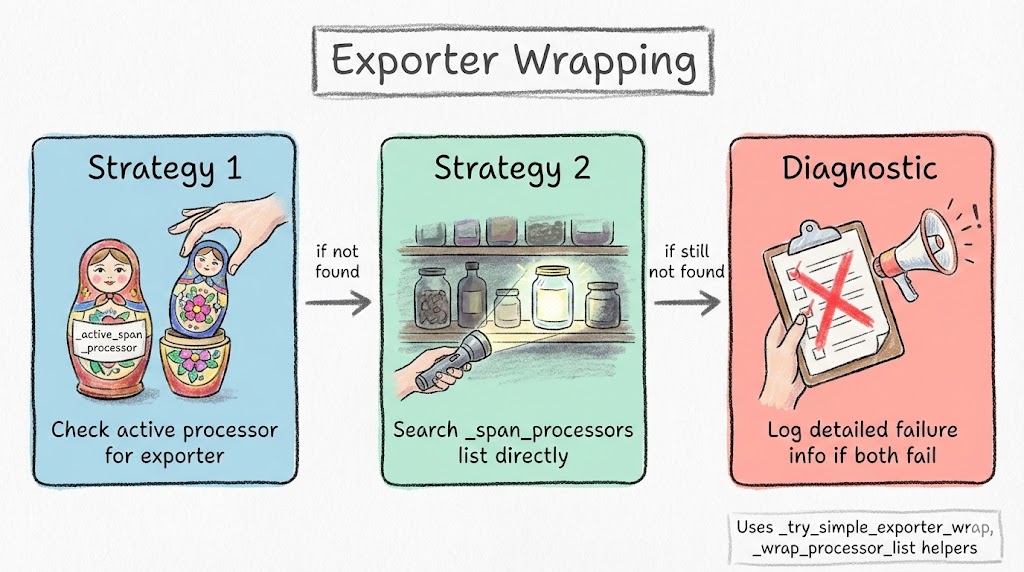
The tricky part is finding and wrapping the exporter inside Traceloop’s OpenTelemetry configuration. Different versions of the SDK organize their span processors differently, so the inject_llm_cost_tracking() function tries multiple strategies:
- Direct exporter wrapping: Find the
BatchSpanProcessor, extract its exporter, wrap it withCostEnrichingSpanExporter, create a new processor - Composite processor traversal: If Traceloop uses a composite processor with multiple children, iterate and wrap each
BatchSpanProcessor - Attribute-based discovery: Check
_active_span_processor,_span_processors, and other internal attributes
The bootstrap is simple. Two lines after Traceloop.init():
| |
After this, every LLM span automatically includes cost data. The attributes appear in Elastic APM as:
numeric_labels.gen_ai_cost_total_usdnumeric_labels.gen_ai_cost_input_usdnumeric_labels.gen_ai_cost_output_usdlabels.gen_ai_cost_providerlabels.gen_ai_cost_model_resolved
Full source:
app/llm_cost_injector.py
9. Getting Started
Everything below is in the companion repo. The repo README has the most up-to-date quickstart and troubleshooting steps.
Prerequisites
- Docker and Docker Compose
- Python 3.11+
- 8GB RAM minimum (Elasticsearch needs headroom)
- OpenAI API key
- Anthropic API key
Quick Start
| |
Generate Test Data
| |
Verify in Kibana
- Open http://localhost:5601 (login:
elastic/changeme) - Navigate to Observability > APM > Services. You should see
recipe-generator-service - Click into a transaction to see the trace waterfall with nested spans
- Click on any LLM span and check the Metadata tab for
gen_ai.*attributes - Import the dashboard:
curl -X POST "http://localhost:5601/api/saved_objects/_import?overwrite=true" -u elastic:changeme -H "kbn-xsrf: true" --form file=@kibana/llm-observability-dashboards.ndjson
Conclusion
The entire stack runs locally in Docker Compose for development. The same architecture (OTel Collector, APM Server, Elasticsearch) scales to production with managed Elastic Cloud. Because every component speaks OTLP, you can swap the backend without touching your application code.
The cost enrichment layer is the most opinionated piece. The demo uses a span exporter wrapper that mutates private attributes, good enough for local development, but for production, move to a SpanProcessor or emit cost as a separate OTel metric (see Section 8).
Check out the full source code on GitHub. Star it if you find it useful.