You shipped an LLM-powered feature. Users love it. Then the invoice arrives. Nobody can explain where $4,000 in API costs went last Tuesday.
LLMs are black boxes in production. You can’t see how many tokens each request burns, which model is slower, or why a batch job at 3 AM quietly retried thousands of failed completions and doubled your daily spend. Traditional APM tools are starting to add LLM support, though coverage and pricing vary. Dedicated LLM observability platforms offer deeper insight out of the box, though many require a proprietary SDK or proxy that ties your instrumentation to a single vendor.
This guide is for teams running OpenSearch — or evaluating it — who want to add LLM observability without adopting a separate vendor. OpenSearch is a natural fit here: it’s Apache 2.0 licensed, runs on AWS as a managed service, and plugs directly into the AWS-native observability stack through Data Prepper and Amazon OpenSearch Ingestion.
In this post, I’ll walk you through building a full LLM monitoring stack using open standards: OpenTelemetry, OpenLLMetry, and OpenSearch. By the end, you’ll have cost tracking, latency metrics, error correlation, and multi-model comparison running in OpenSearch Dashboards, with vendor-neutral telemetry (OpenTelemetry + OTLP) and a swappable instrumentation layer (OpenLLMetry is one option among several).
One honest warning up front: the OpenSearch pipeline involves a field-mapping step that has no equivalent in most other backends. It’s not complicated once you understand it, but skipping it means your cost dashboard shows nothing but zeros. Section 9 covers it in full.
1. OpenTelemetry in 60 Seconds
Before we talk about LLMs, let’s ground ourselves in the observability standard that makes all of this possible.
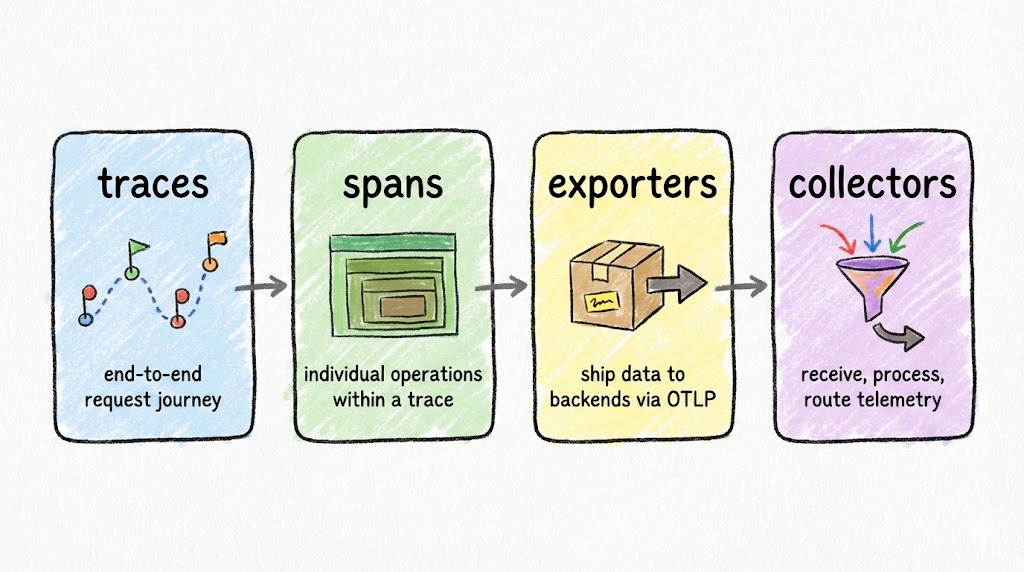
OpenTelemetry (OTel) has four building blocks you need to know:
- Traces capture the full journey of a request through your system, from the HTTP endpoint down to the database query.
- Spans are individual operations within a trace. Each span has a name, duration, status, and arbitrary key-value attributes.
- Exporters ship your trace data out of the application, typically via the OTLP protocol.
- Collectors receive, process, and route telemetry data to your backend of choice (OpenSearch, Jaeger, Datadog, or anything that speaks OTLP).
Why does OTel matter for LLM apps? Because it’s vendor-neutral and composable. You instrument once and send data anywhere. When your observability needs change (and they will), you swap the backend, not the instrumentation code.
2. Enter OpenLLMetry
OpenTelemetry handles generic telemetry. LLM calls have unique attributes (model names, token counts, prompt content, system identifiers) that standard OTel instrumentation doesn’t capture. That’s where OpenLLMetry comes in.
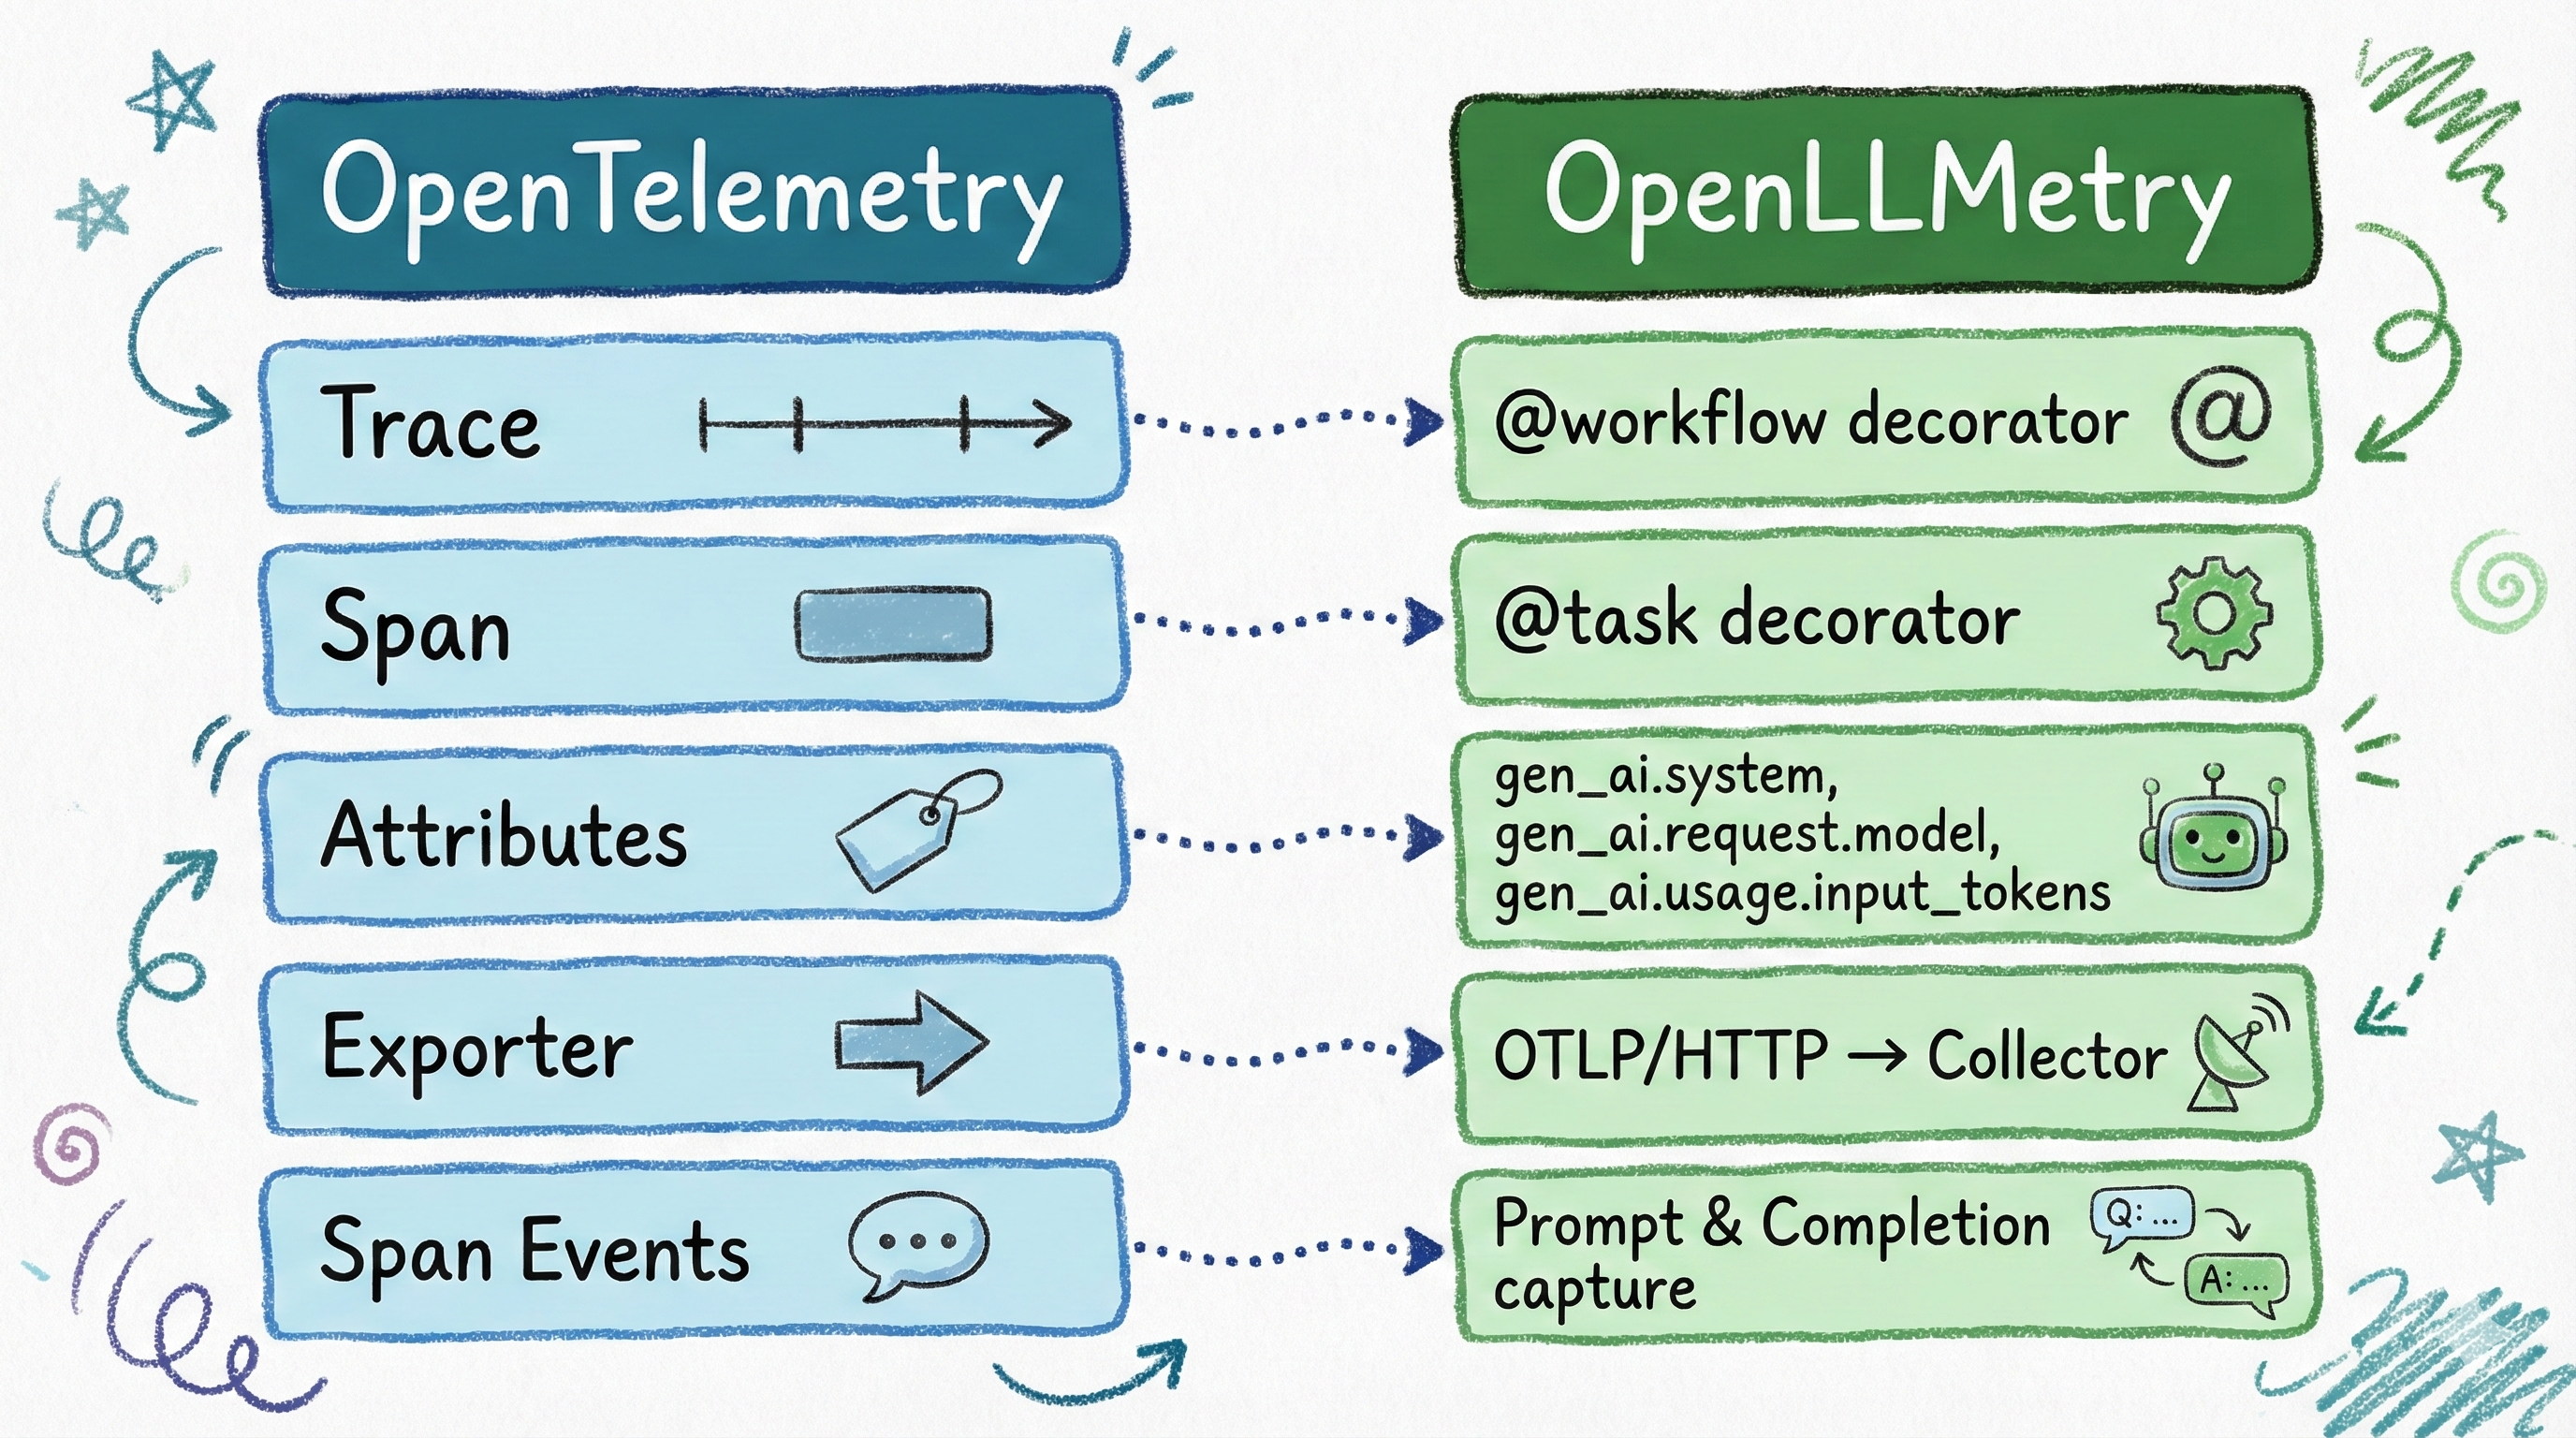
OpenLLMetry is Traceloop’s open-source instrumentation layer built on top of OpenTelemetry. It maps cleanly to OTel’s concepts:
| OTel Concept | OpenLLMetry Equivalent |
|---|---|
| Trace | @workflow decorator |
| Span | @task decorator |
| Attributes | Auto-captured gen_ai.* fields |
| Exporter | Same OTLP exporter — unchanged |
When you decorate a function with @task, OpenLLMetry automatically captures gen_ai.request.model, gen_ai.usage.input_tokens, gen_ai.usage.output_tokens, gen_ai.system, and more. No manual attribute setting required. The @workflow decorator creates a top-level span that groups related @task spans into a single trace hierarchy, giving you end-to-end visibility into multi-step LLM operations.
Some gen_ai.* attribute names are evolving as the semantic conventions mature. Check the latest spec for current names.
3. Before vs After: The Code
Compare LLM instrumentation with raw OpenTelemetry versus OpenLLMetry.
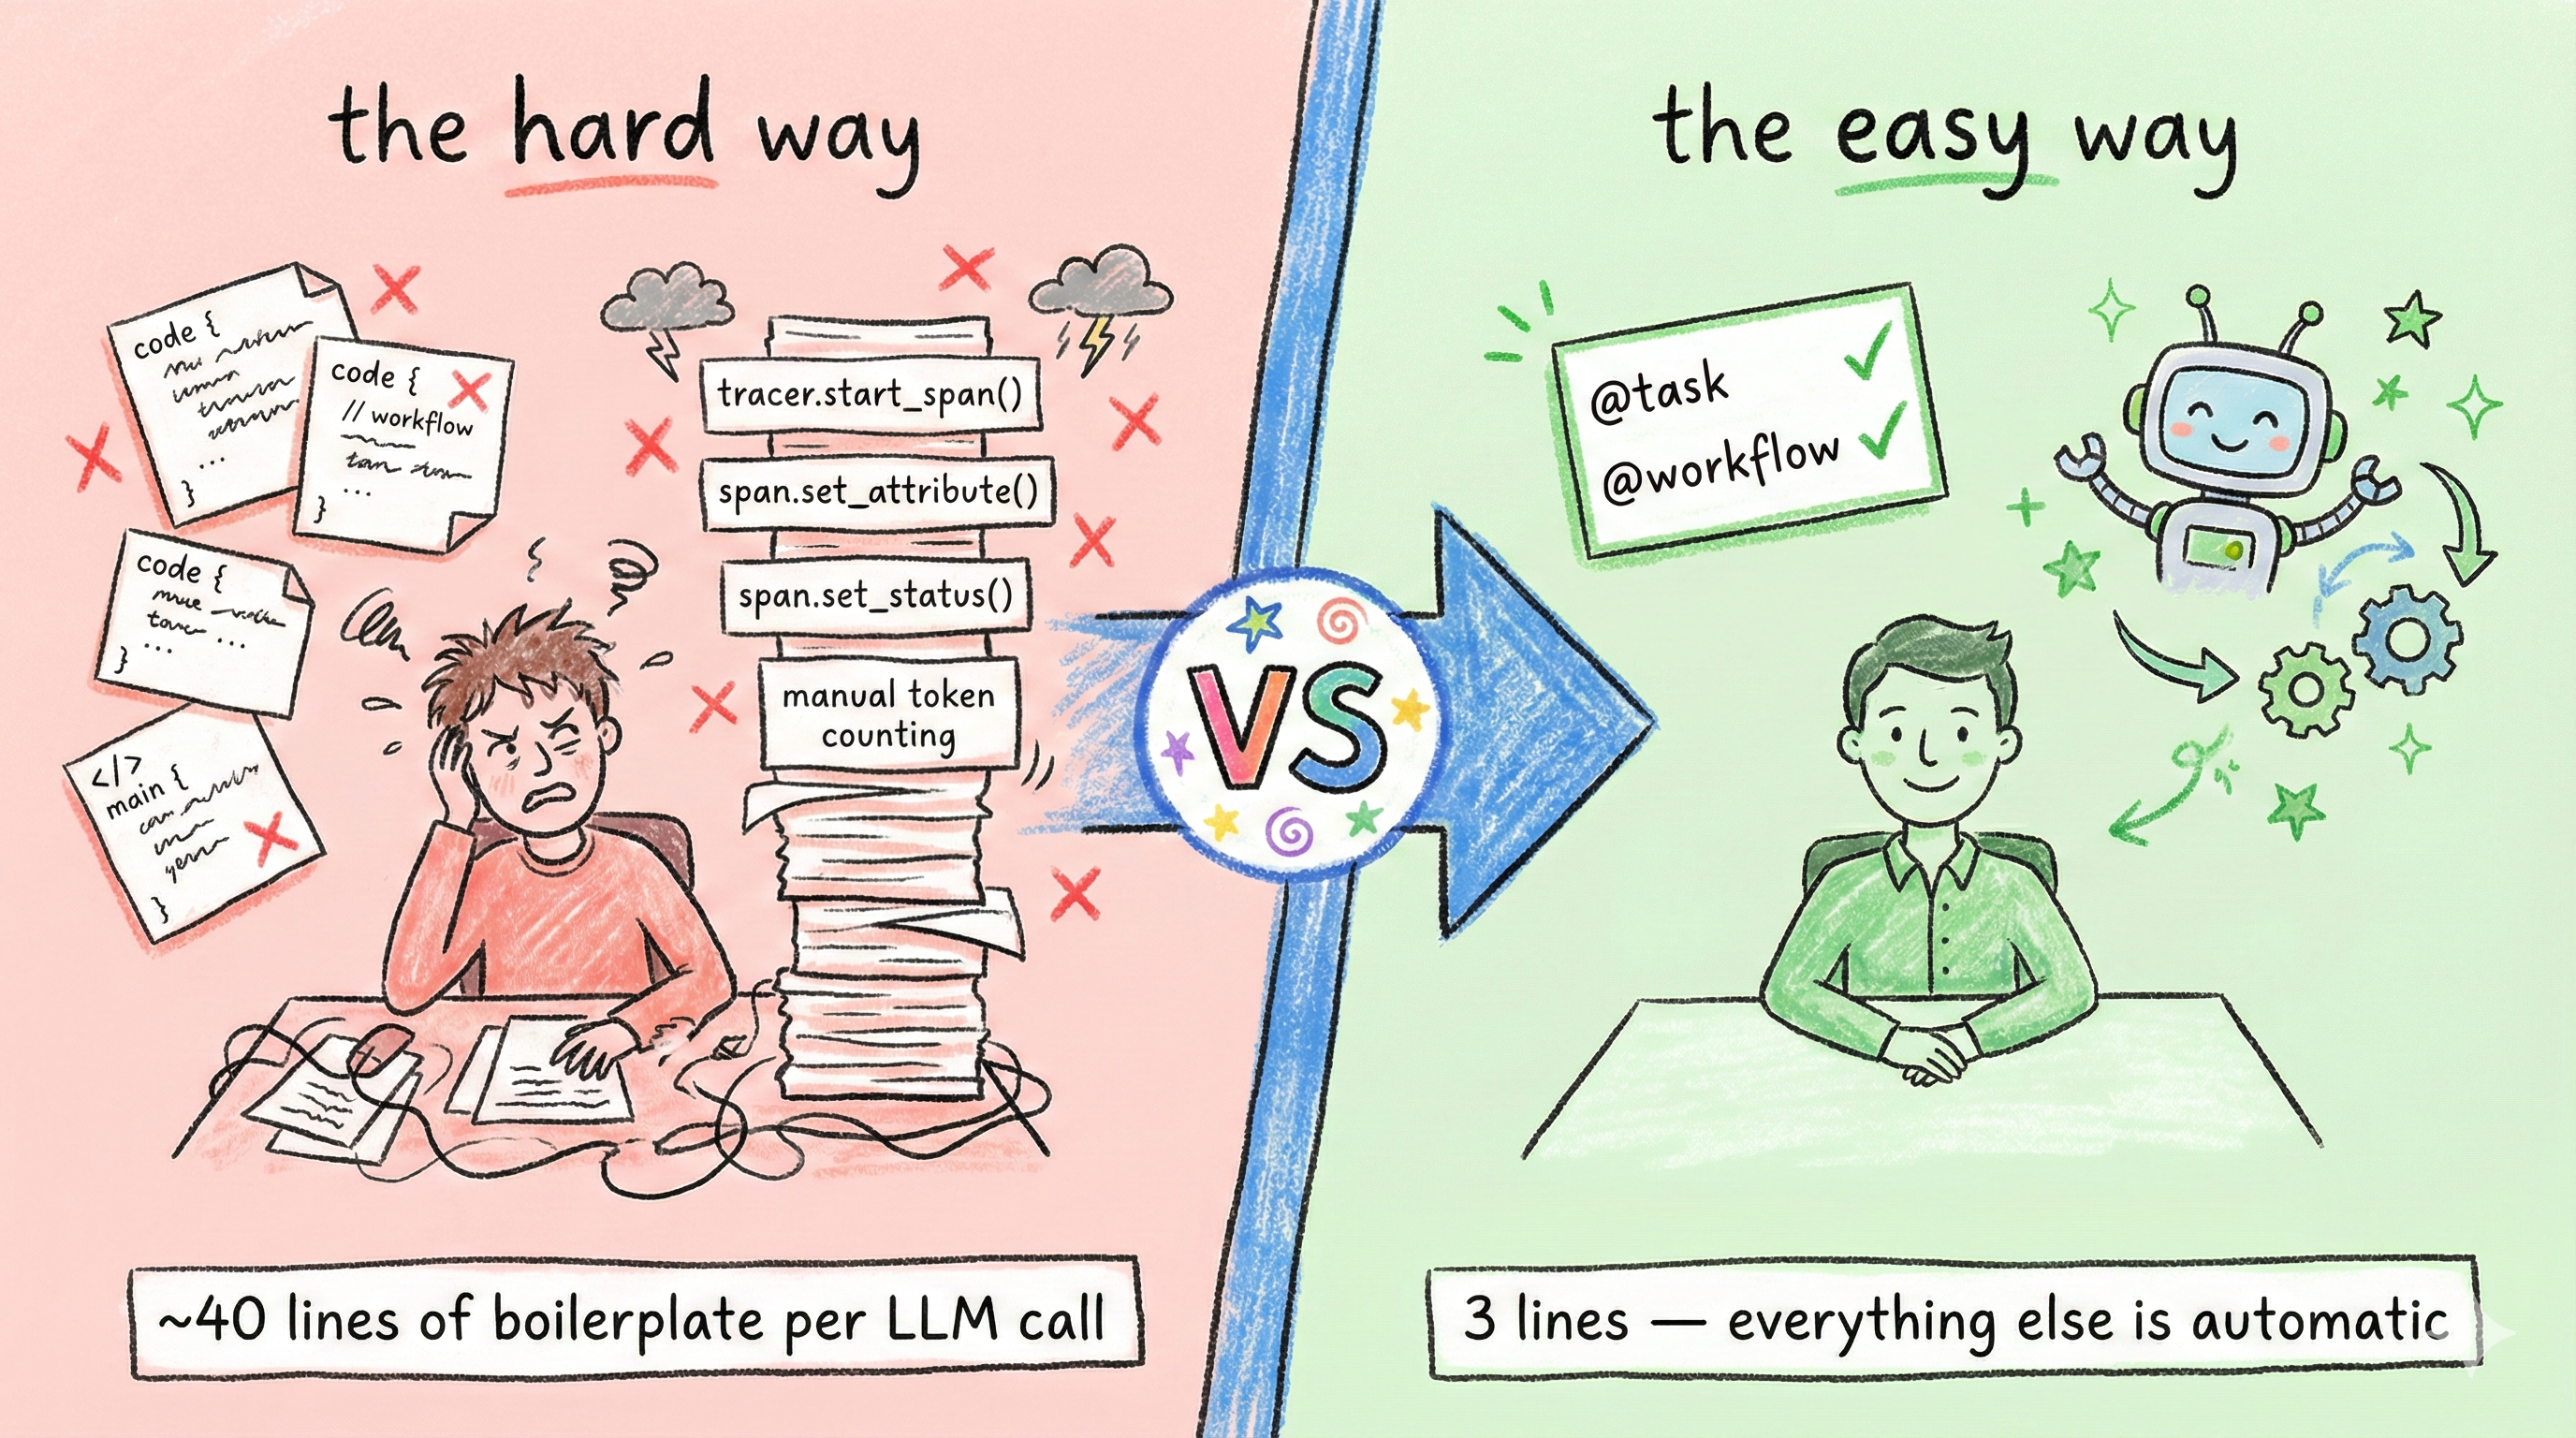
The Hard Way: Manual OpenTelemetry
First, the setup boilerplate. About 10 lines before you write any business logic:
| |
Then, every single LLM call function needs ~25 lines of manual instrumentation:
| |
That’s 4 imports, manual provider/processor/exporter wiring, manual span creation, manual attribute setting for every gen_ai field, manual response capture, and manual error handling. Repeat this for every LLM function in your codebase.
The Easy Way: OpenLLMetry
Setup is trivial: two imports, one init call.
| |
Production safety: prompts, PII, and trace size. OpenLLMetry can log prompts and completions into span attributes. Useful for debugging, but also a way to leak sensitive data into your observability backend. Disable content tracing in production unless you explicitly need it:
export TRACELOOP_TRACE_CONTENT=false. With content tracing disabled, OpenLLMetry logs metadata (model name, token counts, latency) without capturing prompts or responses. Don’t log raw customer identifiers (hash them or use a surrogate ID), treat traces as a data store where retention and access control matter, and if you must log content, redact aggressively. See Traceloop’s privacy docs for selective per-workflow controls.
The business logic stays clean. Just add decorators:
| |
The key takeaway: zero manual span or attribute management. OpenLLMetry intercepts the OpenAI and Anthropic client libraries, captures all the gen_ai.* attributes automatically, and your functions contain nothing but business logic.
What about OTel’s own auto-instrumentation? The opentelemetry-instrumentation-openai package also auto-captures gen_ai.* attributes without manual span code. The tradeoff is that it gives you auto-instrumentation for LLM calls but not the @workflow/@task decorator model for grouping business logic into named trace hierarchies. OpenLLMetry adds that layer on top, which is why I chose it for this project. If you only need LLM call telemetry without workflow grouping, the native OTel instrumentation is a lighter option.
4. System Architecture
The full pipeline from your Flask app to an OpenSearch Dashboards dashboard.
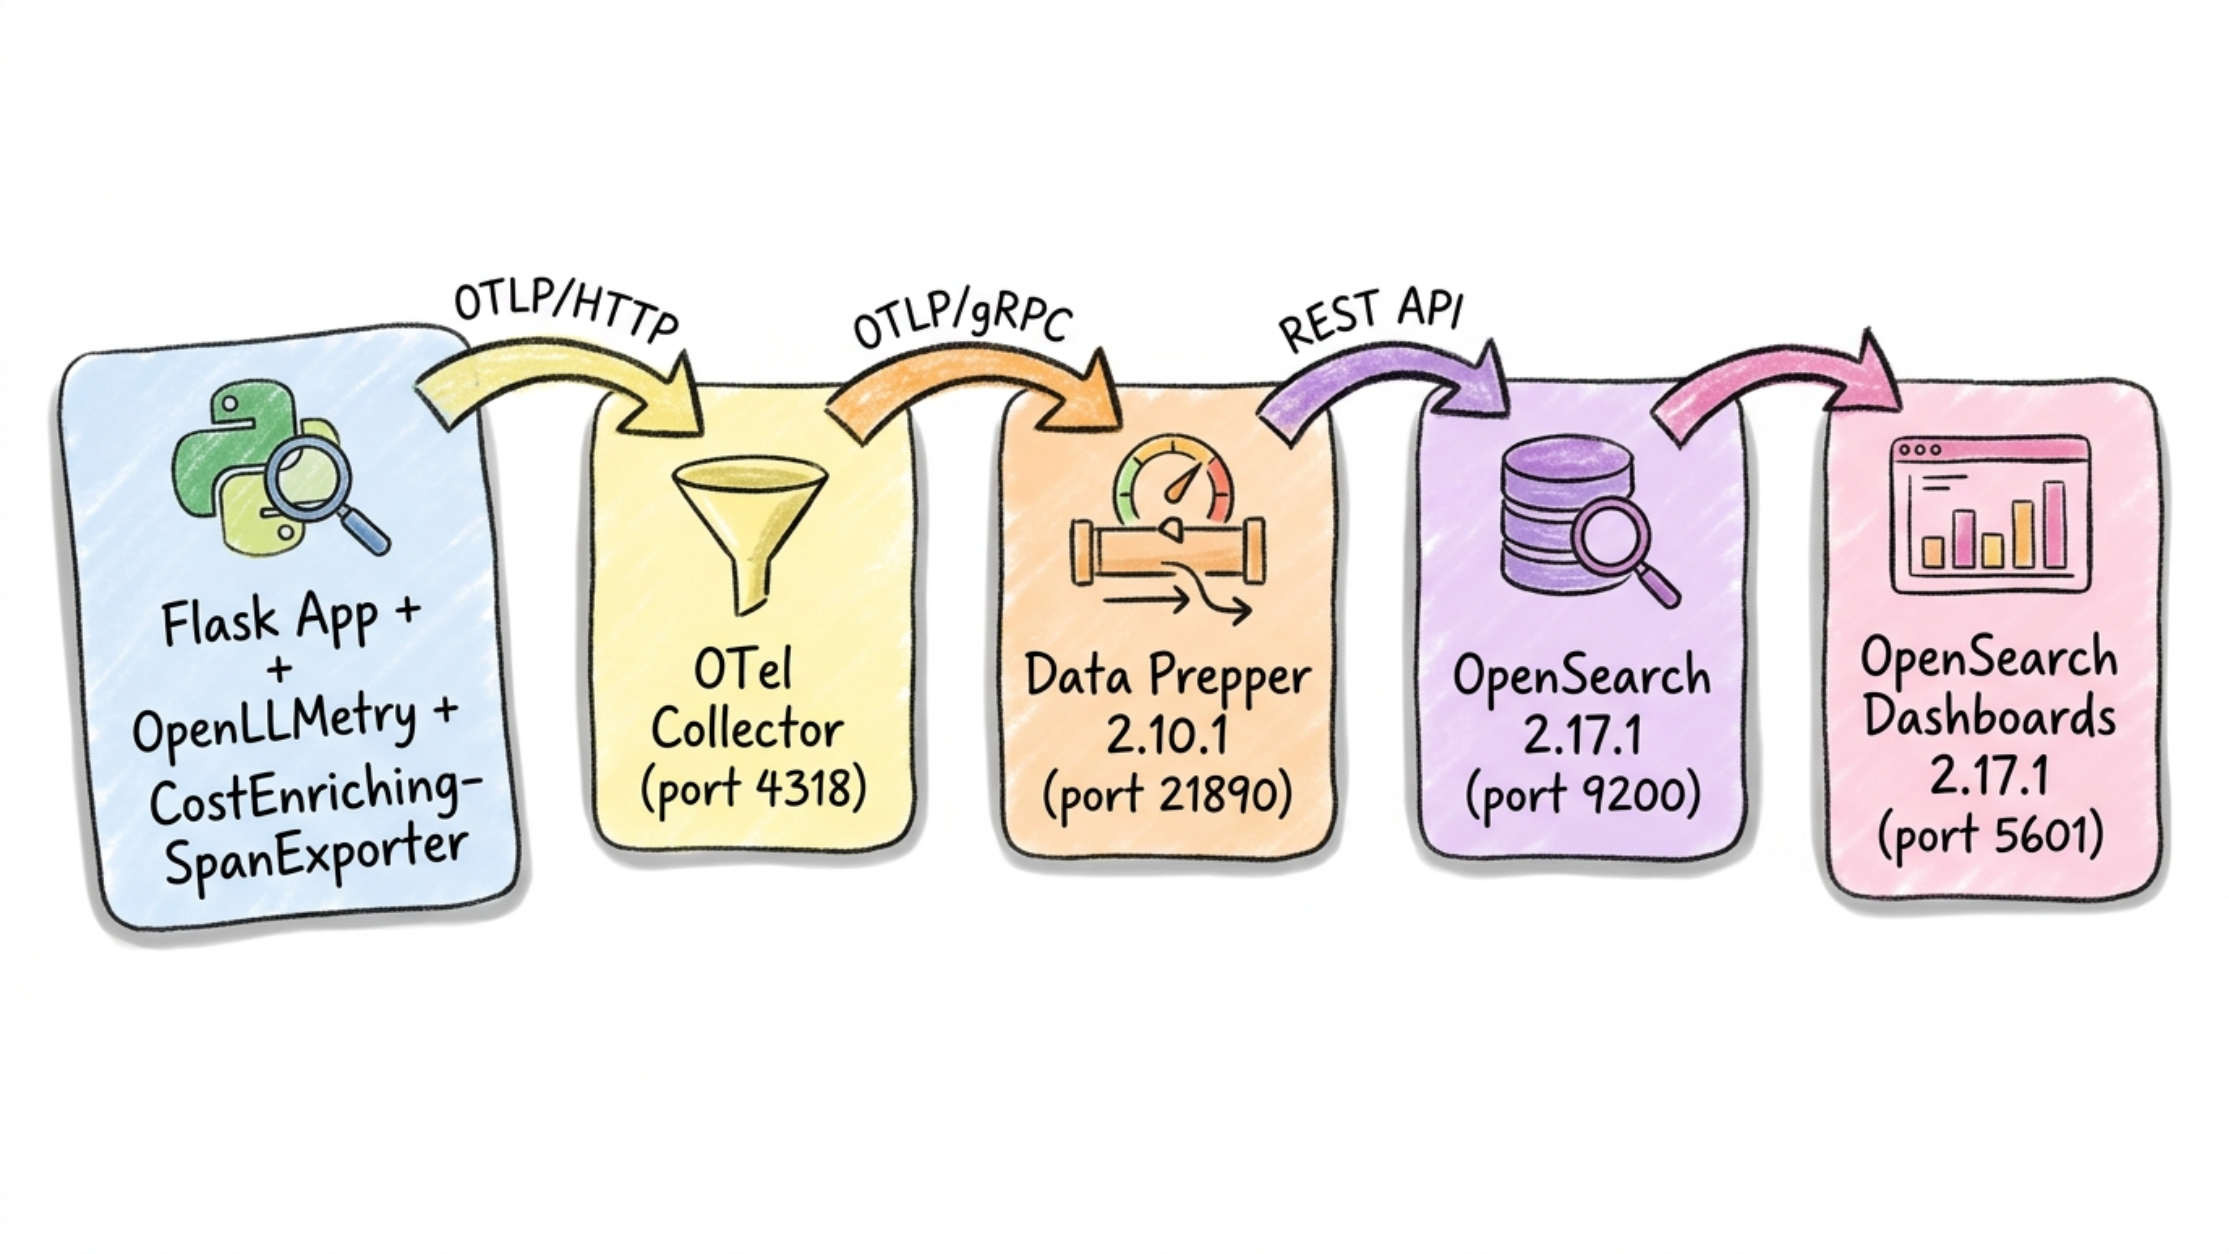
The stack has six components, all running in Docker Compose on a single bridge network:
- Flask App: Your Python application, instrumented with OpenLLMetry decorators.
- OpenLLMetry SDK: Auto-instruments OpenAI and Anthropic client libraries, captures
gen_ai.*attributes, exports via OTLP/HTTP. - OpenTelemetry Collector: Receives OTLP/HTTP on port 4318, batches spans, applies memory limits, and routes to Data Prepper via OTLP/gRPC.
- Data Prepper: OpenSearch’s native trace ingestion component. Receives OTLP/gRPC on port 21890, processes raw spans through the
otel_trace_rawprocessor, builds a service map, and writes tootel-v1-apm-span-*andotel-v1-apm-service-mapindices. - OpenSearch: Stores all trace data. The
gen_ai.*span attributes land underspan.attributes.*— with one important twist covered in Section 9. - OpenSearch Dashboards: Provides Trace Analytics (service map, trace explorer, span drill-down) and custom dashboards.
Field naming reality (Data Prepper + OTel): Data Prepper replaces every
.with@when flattening OTel span attributes into indexed documents. Every field reference in your dashboards and queries must use@separators, not.. For example:gen_ai.request.model→span.attributes.gen_ai@request@model,gen_ai.cost.total_usd→span.attributes.gen_ai@cost@total_usd. There is no configuration option. It just happens. This is documented in Section 9.
The data flow is straightforward: your app sends OTLP/HTTP to the Collector, which forwards OTLP/gRPC to Data Prepper, which writes to OpenSearch. OpenSearch Dashboards reads from OpenSearch. No custom adapters, no proprietary protocols.
I considered sending OTLP directly from the app to Data Prepper, skipping the Collector entirely. It works for a single service, but the Collector gives you a buffer for backpressure, a place to add processors later (attribute filtering, sampling), and decouples your app from the backend topology. For anything beyond a demo, it’s worth the extra container.
The Docker Compose overview:
| |
See the full
docker-compose.ymlandotel-collector-config.yamlin the companion repo.
5. Building a Multi-Agent Workflow
The real test for any observability stack is multi-agent systems where multiple models collaborate, run in parallel, retry on failure, and feed each other’s outputs. That’s the scenario I built to put this stack through its paces.
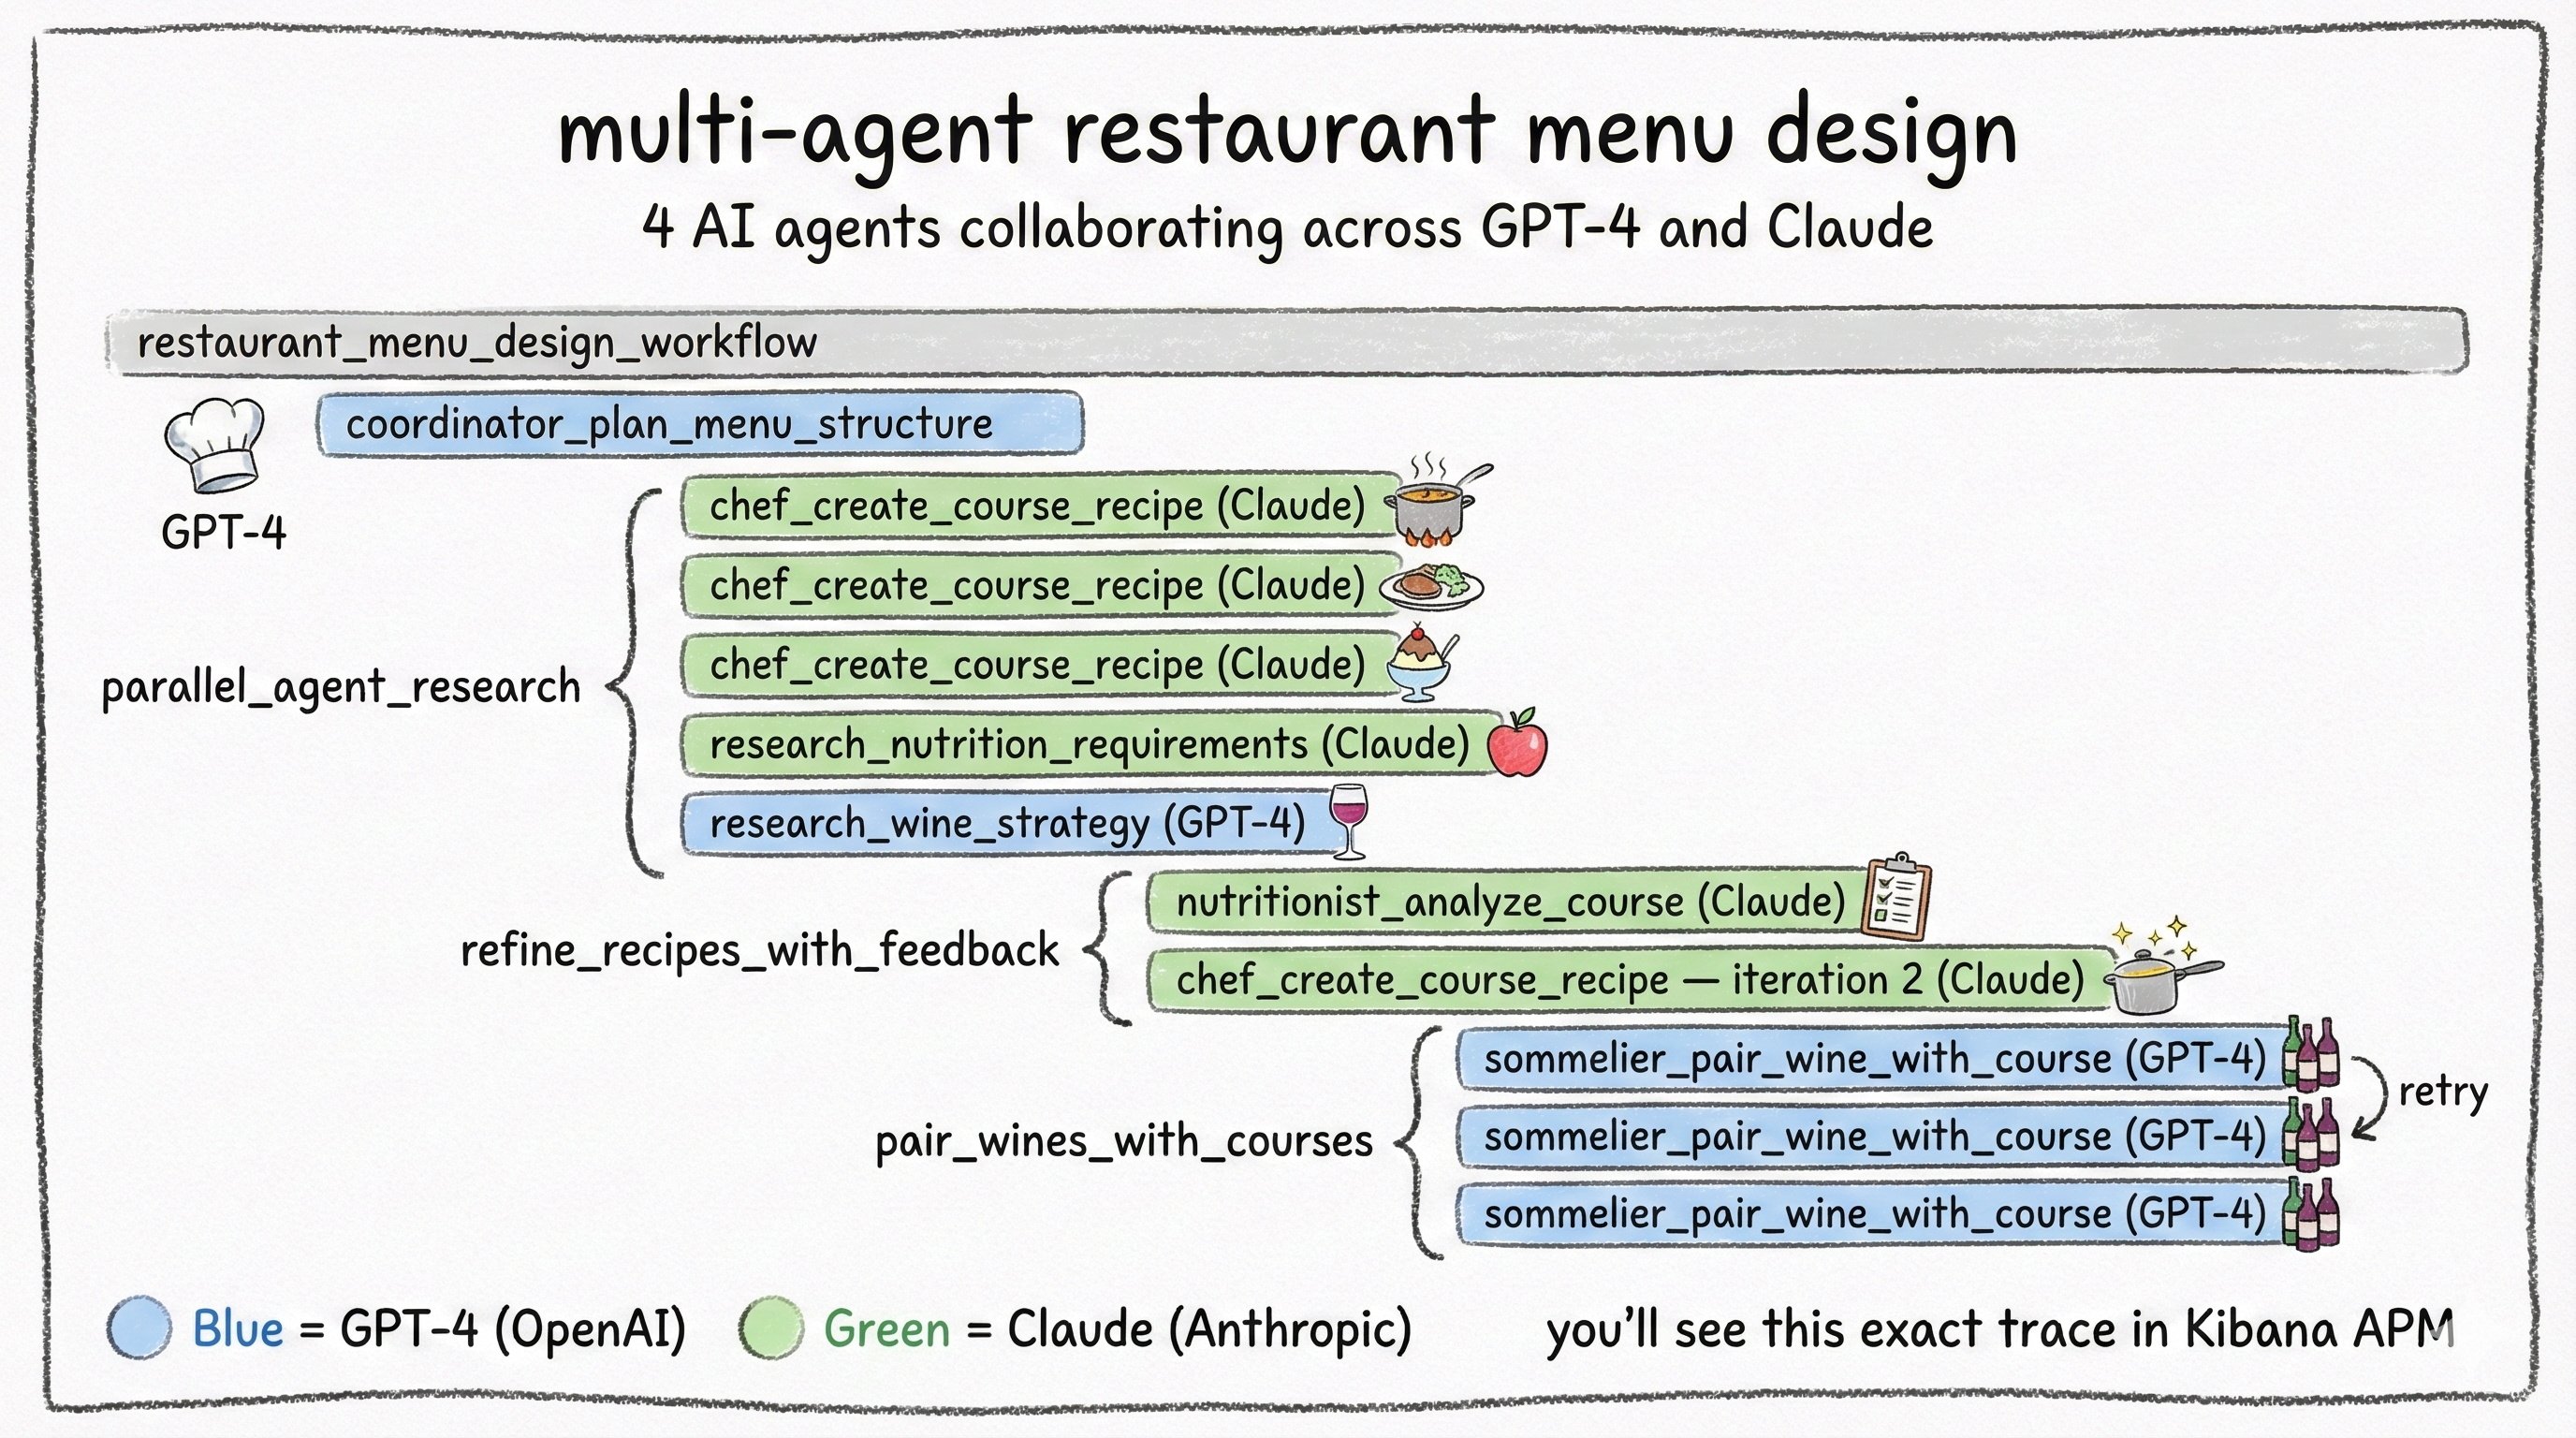
The Restaurant Menu Designer orchestrates 4 AI agents to create a complete fine-dining menu:
| Agent | Model | Role |
|---|---|---|
| Menu Coordinator | GPT (OpenAI) | Strategic planning — designs the course structure |
| Executive Chef | Claude (Anthropic) | Creative — generates detailed recipes for each course |
| Nutritionist | Claude Haiku (Anthropic) | Analytical — reviews nutritional compliance, approves or requests changes |
| Sommelier | GPT (OpenAI) | Expert pairing — matches wines to each course |
The workflow runs in 5 phases:
- Coordinator plans the menu structure (sequential)
- Parallel research: Chef creates recipes, Nutritionist researches dietary guidelines, Sommelier develops a pairing strategy (concurrent via
ThreadPoolExecutor) - Recipe refinement: Nutritionist reviews each recipe, Chef iterates based on feedback (nested workflow with retry logic, max 3 iterations)
- Wine pairing: Sommelier pairs each course (includes automatic retry on incomplete results)
- Final assembly: combine everything into the complete menu
| |
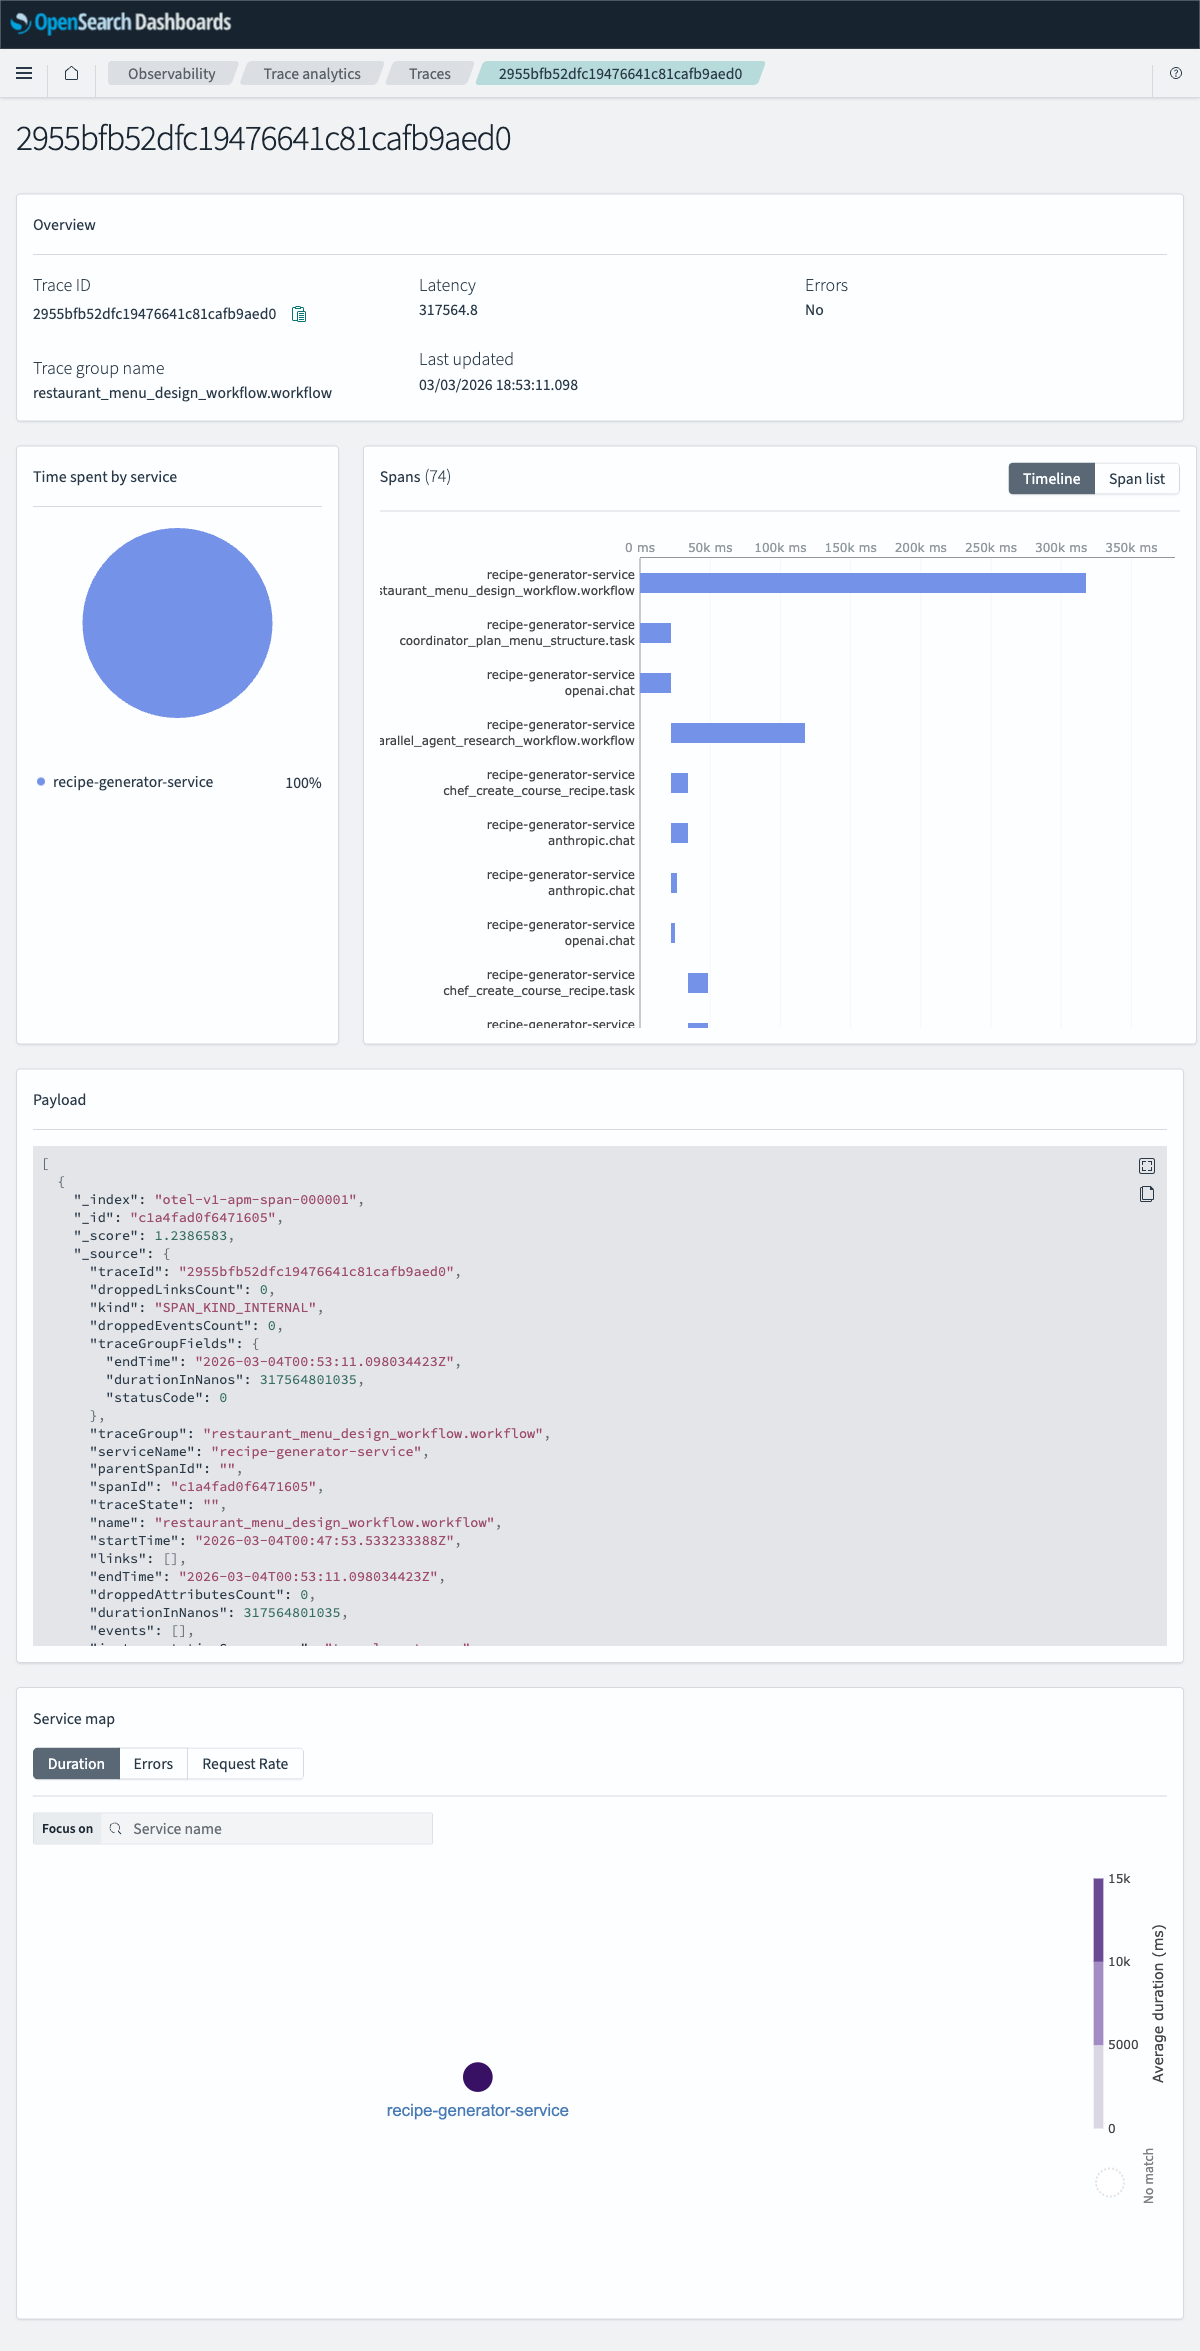
This creates a deeply nested trace with 15-20 spans: parallel execution branches, cross-model calls (GPT for planning, Claude for creativity), retry attempts visible as iteration counters, and the full agent-to-agent data flow. It’s the perfect stress test for any observability system, and it renders clearly in OpenSearch Dashboards’ Trace Analytics waterfall view.
Context propagation across threads is not automatic in Python. If you run tasks in a thread pool, you need threading context propagation so spans created in worker threads remain parented to the originating workflow span.
Traceloop/OpenLLMetry enables OpenTelemetry’s threading context propagation so the active trace context follows work scheduled onto threads. The key idea is propagate context, not “generate extra telemetry.”
If you ever see parallel tasks showing up as separate traces in Trace Analytics, context propagation is the first thing to verify. This was the most time-consuming debugging problem in the entire project. The symptoms are subtle: everything works, traces appear, but parallel tasks show up as orphaned root spans instead of children of the workflow. If you’re seeing that, check context propagation before anything else.
Full implementation:
app/app.py
6. What You Can Monitor
Once traces are flowing into OpenSearch, this is what you get out of the box.
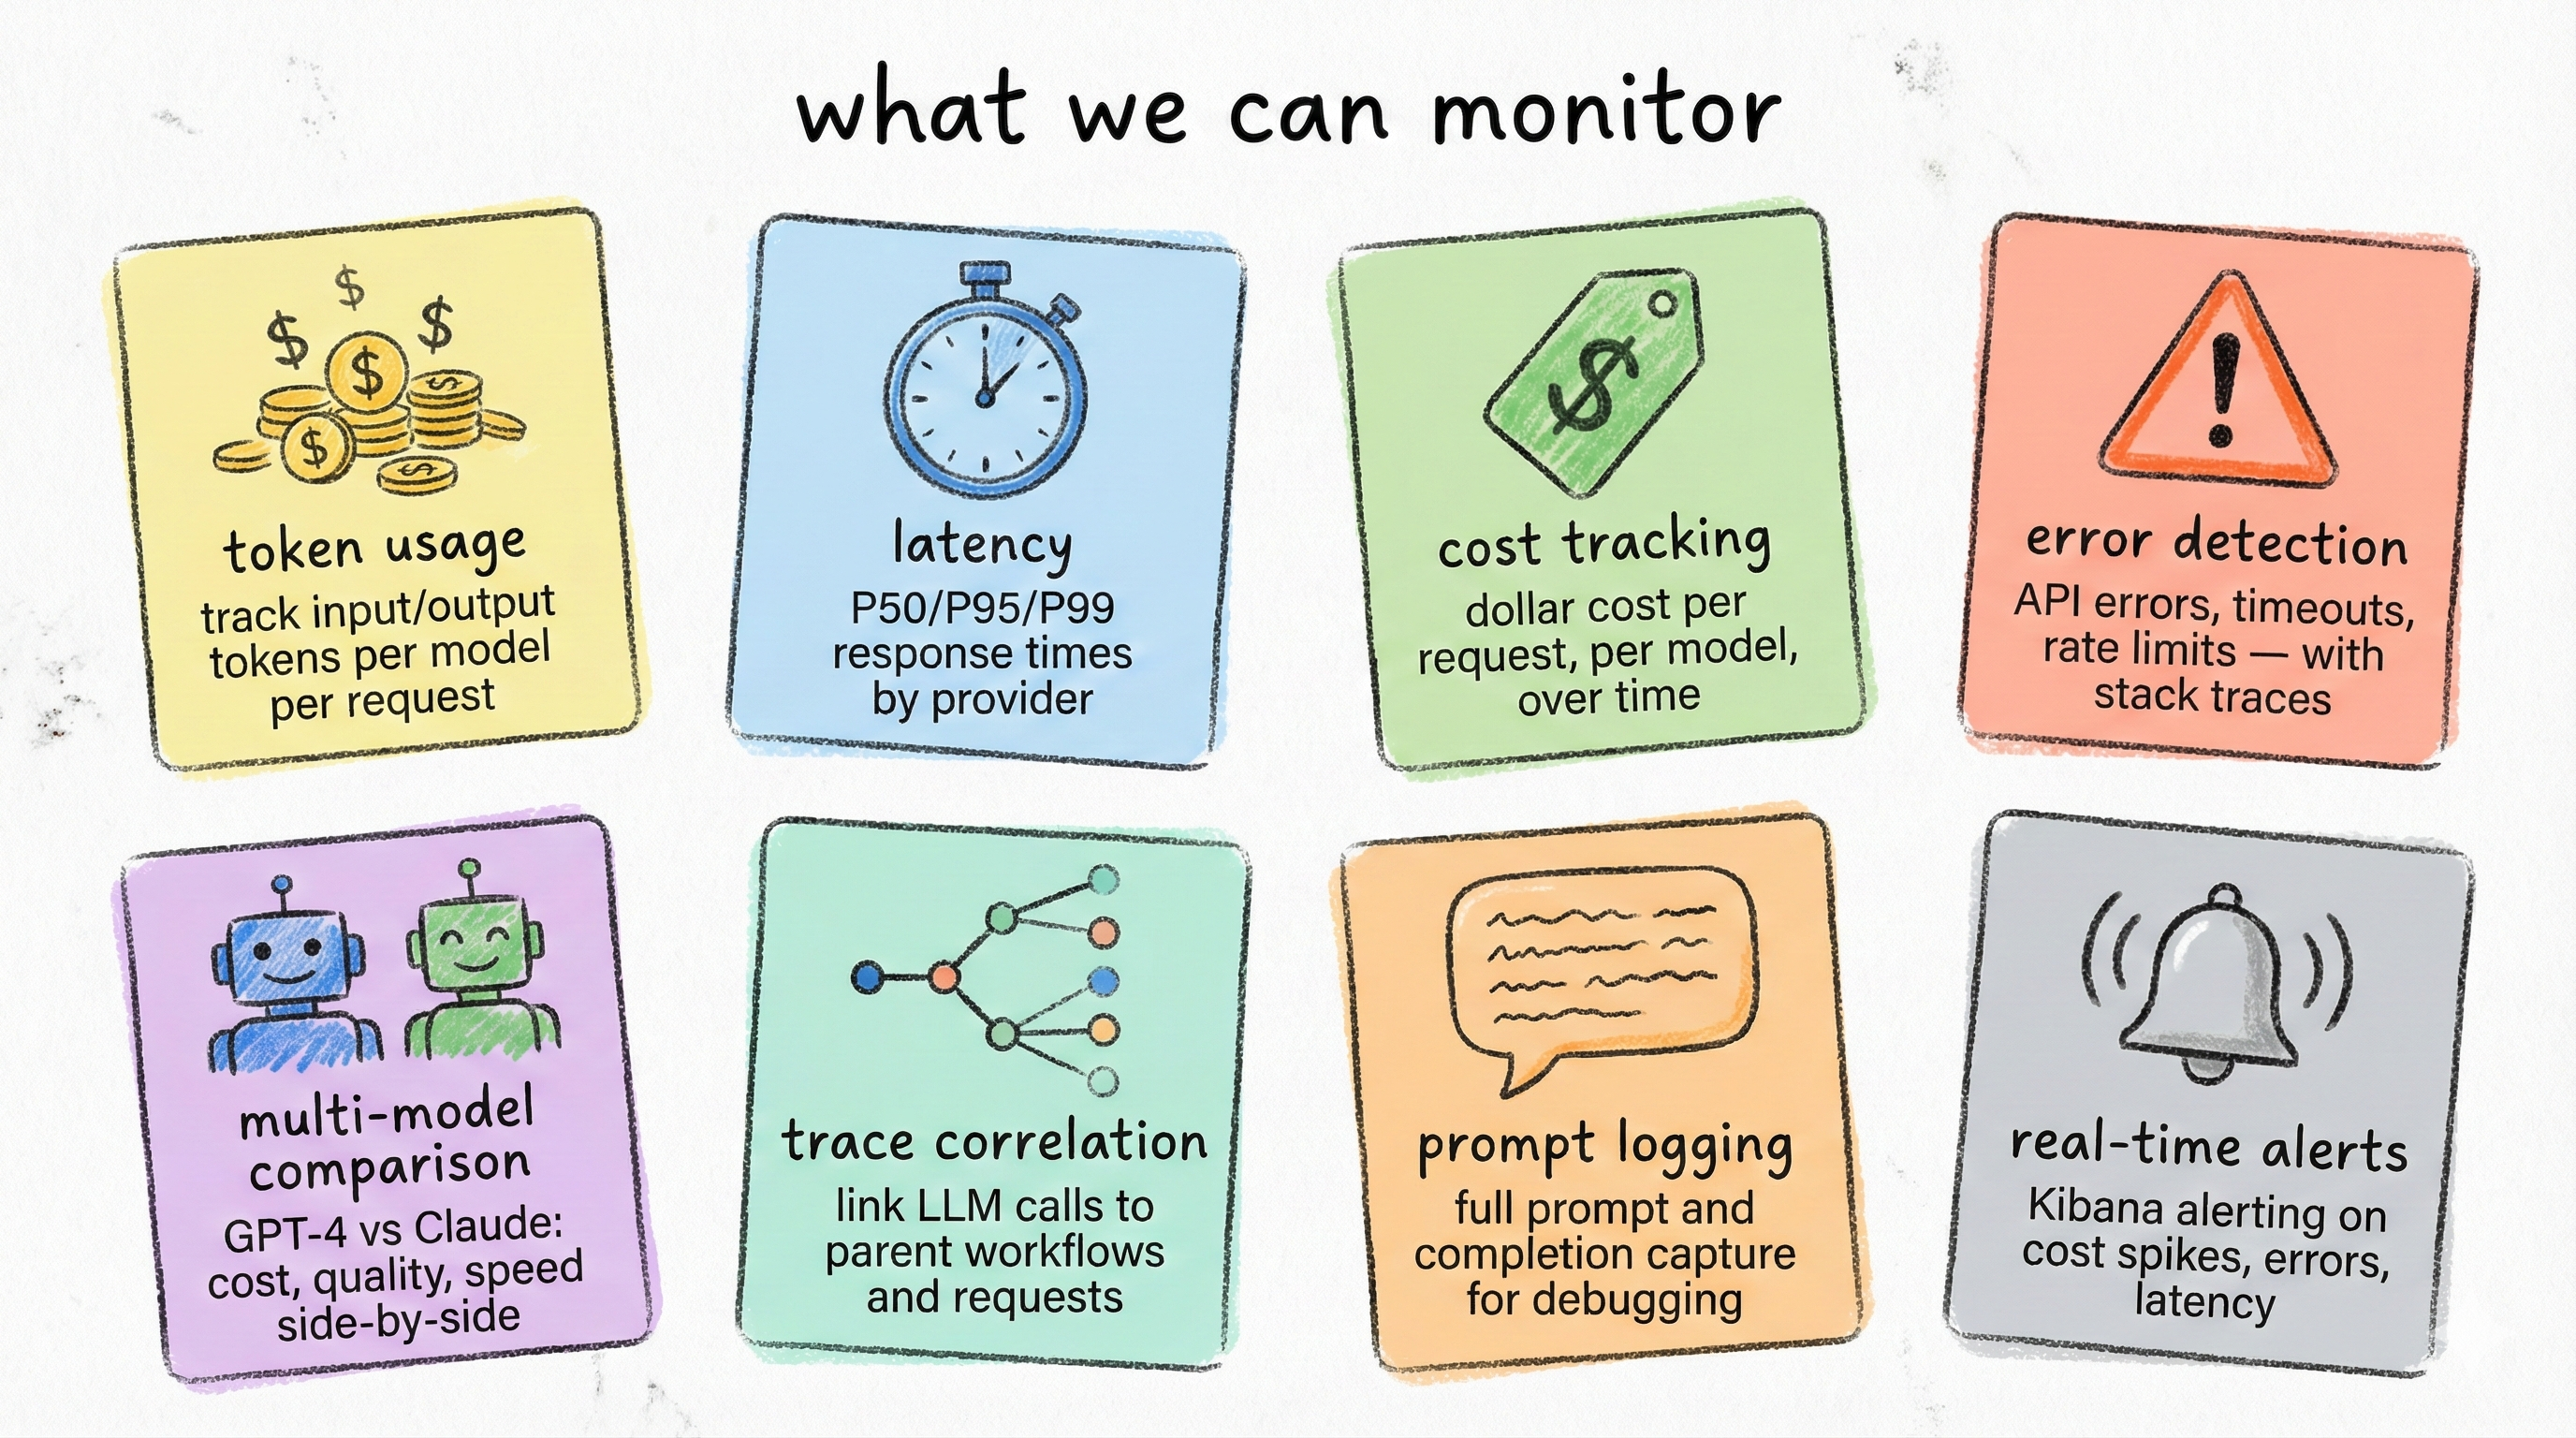
Eight capabilities, each powered by the gen_ai.* attributes that OpenLLMetry captures automatically:
| Capability | What You See | Why It Matters |
|---|---|---|
| Token Usage | Input/output tokens per call, per model | Optimize prompts, catch token inflation |
| Latency | Response time (avg, P95) per model and endpoint | SLA monitoring, provider comparison |
| Cost Tracking | Dollar cost per call, per workflow, per model | Budget control, cost allocation |
| Error Detection | Failed LLM calls with stack traces and retry counts | Reliability monitoring, root cause analysis |
| Multi-Model Comparison | Side-by-side metrics across GPT, Claude, etc. | Informed model selection |
| Trace Correlation | Full request path from HTTP endpoint to LLM call | Debug complex multi-agent workflows |
| Prompt Logging | System/user prompts and completions stored in span attributes | Audit trail, prompt debugging |
| Alerts | OpenSearch alerting rules on any metric | Token budget alerts, latency spikes, error rate thresholds |
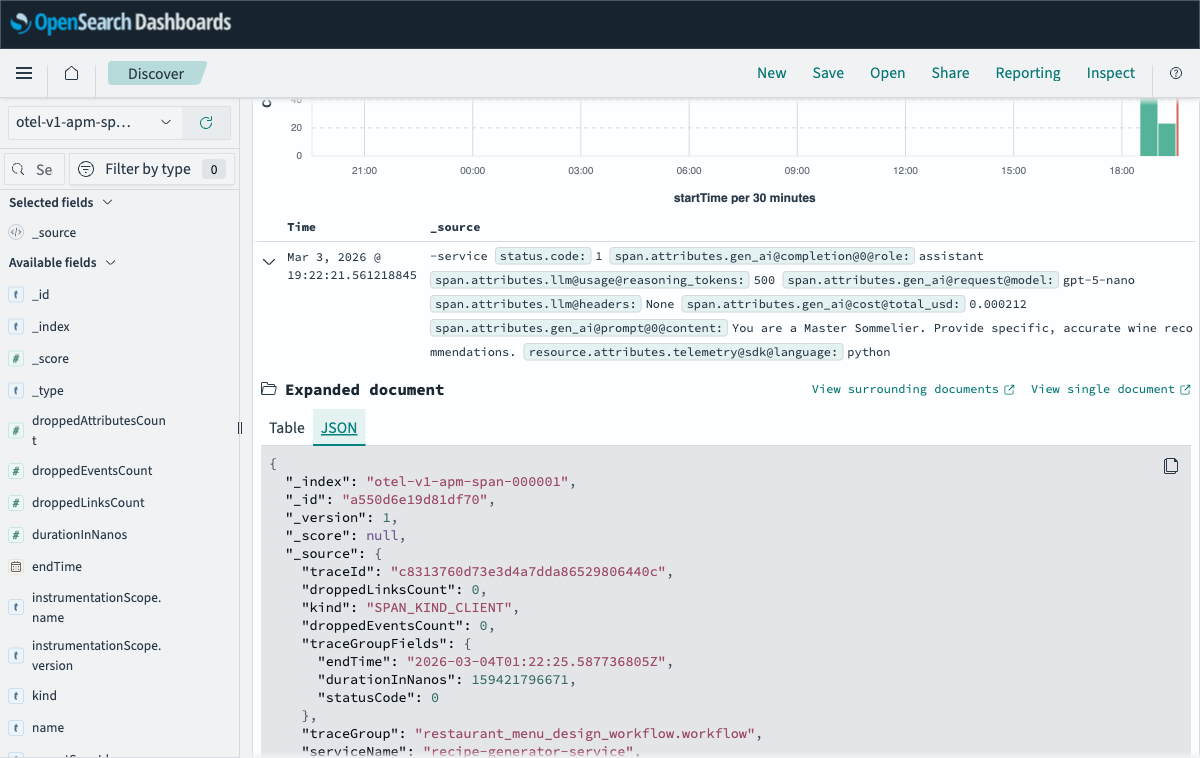
In OpenSearch Dashboards, you can explore these through Trace Analytics (service map, trace list, span drill-down) and Discover (search and filter raw spans). The service map shows your app’s live dependency graph on LLM providers. The trace waterfall lets you drill into individual requests. Discover lets you search spans by any gen_ai.* attribute.
Sampling warning: If you sample traces (e.g., 10%), dashboards built from trace data will underestimate tokens and cost unless you compensate. For cost governance, prefer always-on LLM spans or emit token/cost counters as separate OTel metrics alongside traces.
A note on streaming: The examples in this post use non-streaming completions. OpenLLMetry supports streaming, but the behavior differs. Token counts are accumulated incrementally and the span closes when the stream finishes, which can affect latency measurements. If your app streams responses, verify instrumentation behavior with your specific provider SDK version before relying on the metrics.
Traces vs. metrics for cost tracking. This post uses trace-based cost attribution, which gives you per-request granularity. At scale, you may also want to emit OTel metrics alongside traces. Metrics are pre-aggregated, cheaper to store, and aren’t affected by trace sampling. A common production pattern is: always-on metrics for dashboards and alerts, sampled traces for debugging specific requests.
7. The Dashboard
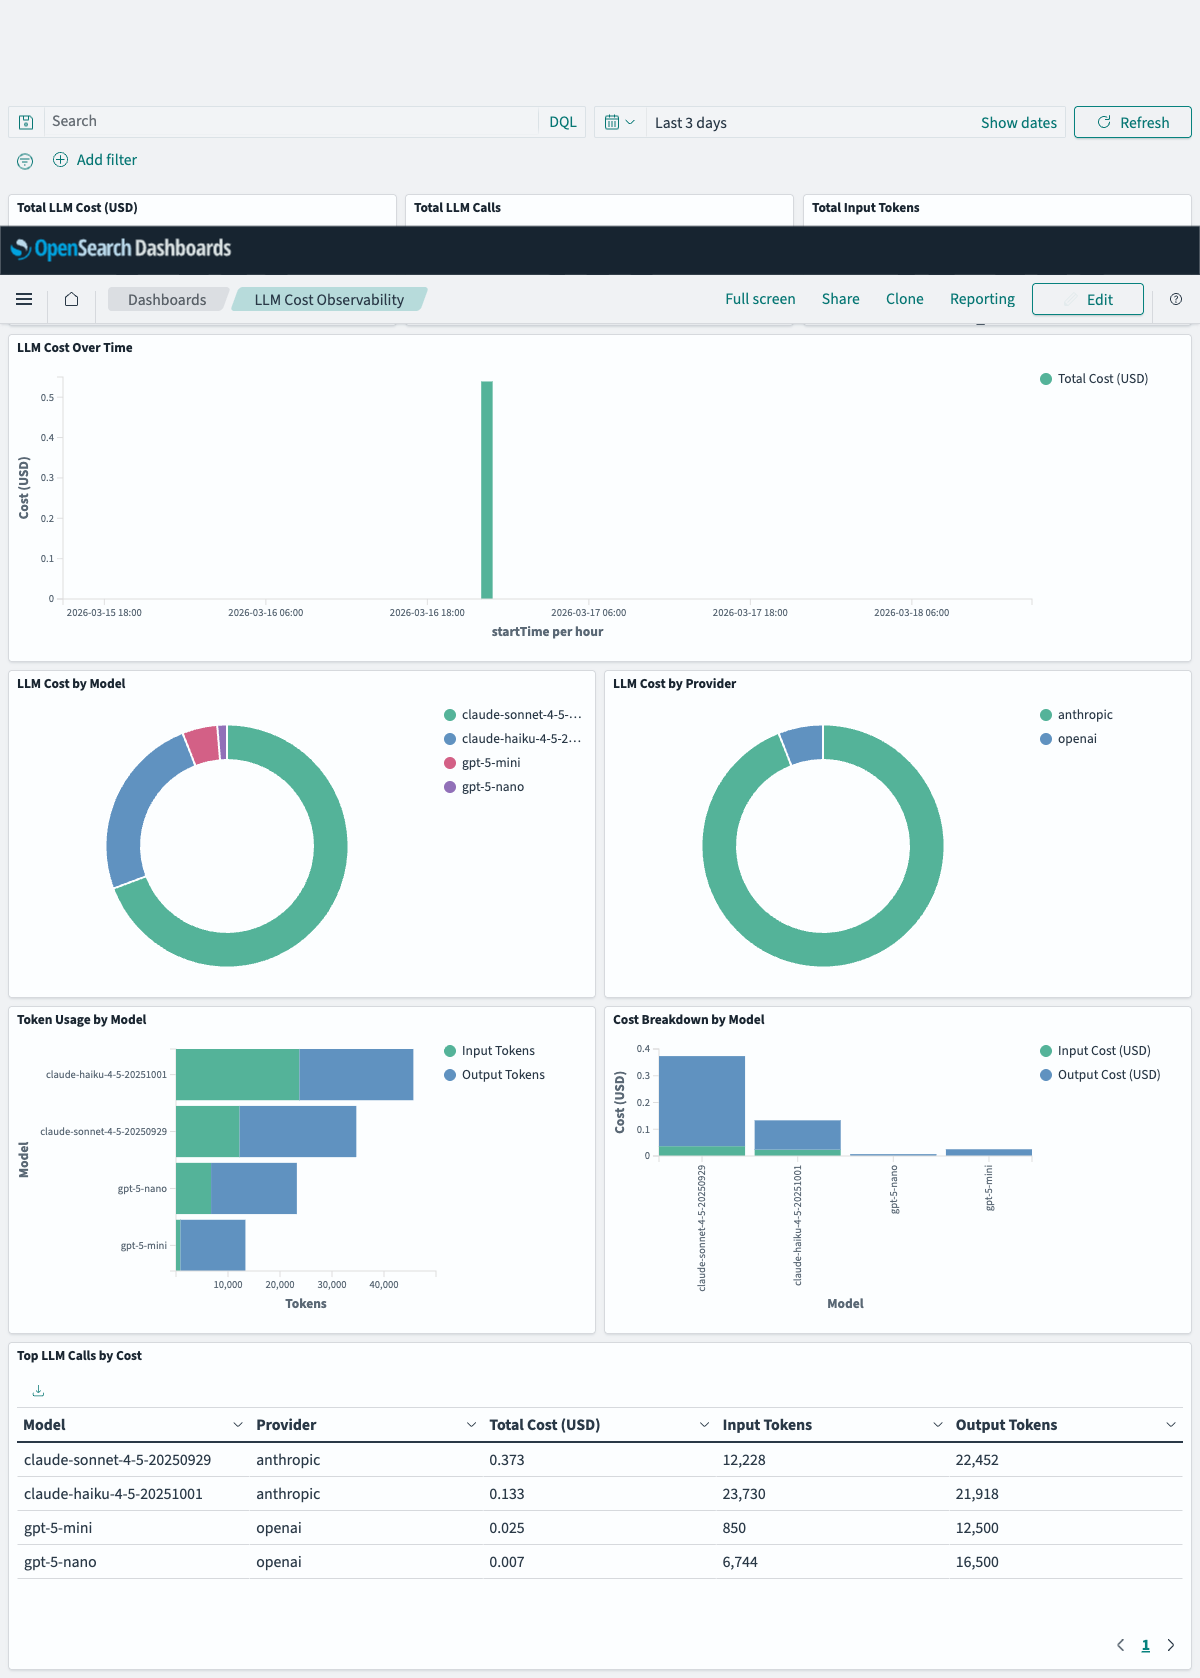
All of this data is visible in Trace Analytics, but for day-to-day monitoring you want a dashboard. I built a 9-panel OpenSearch Dashboards dashboard that gives you the full LLM observability picture at a glance.
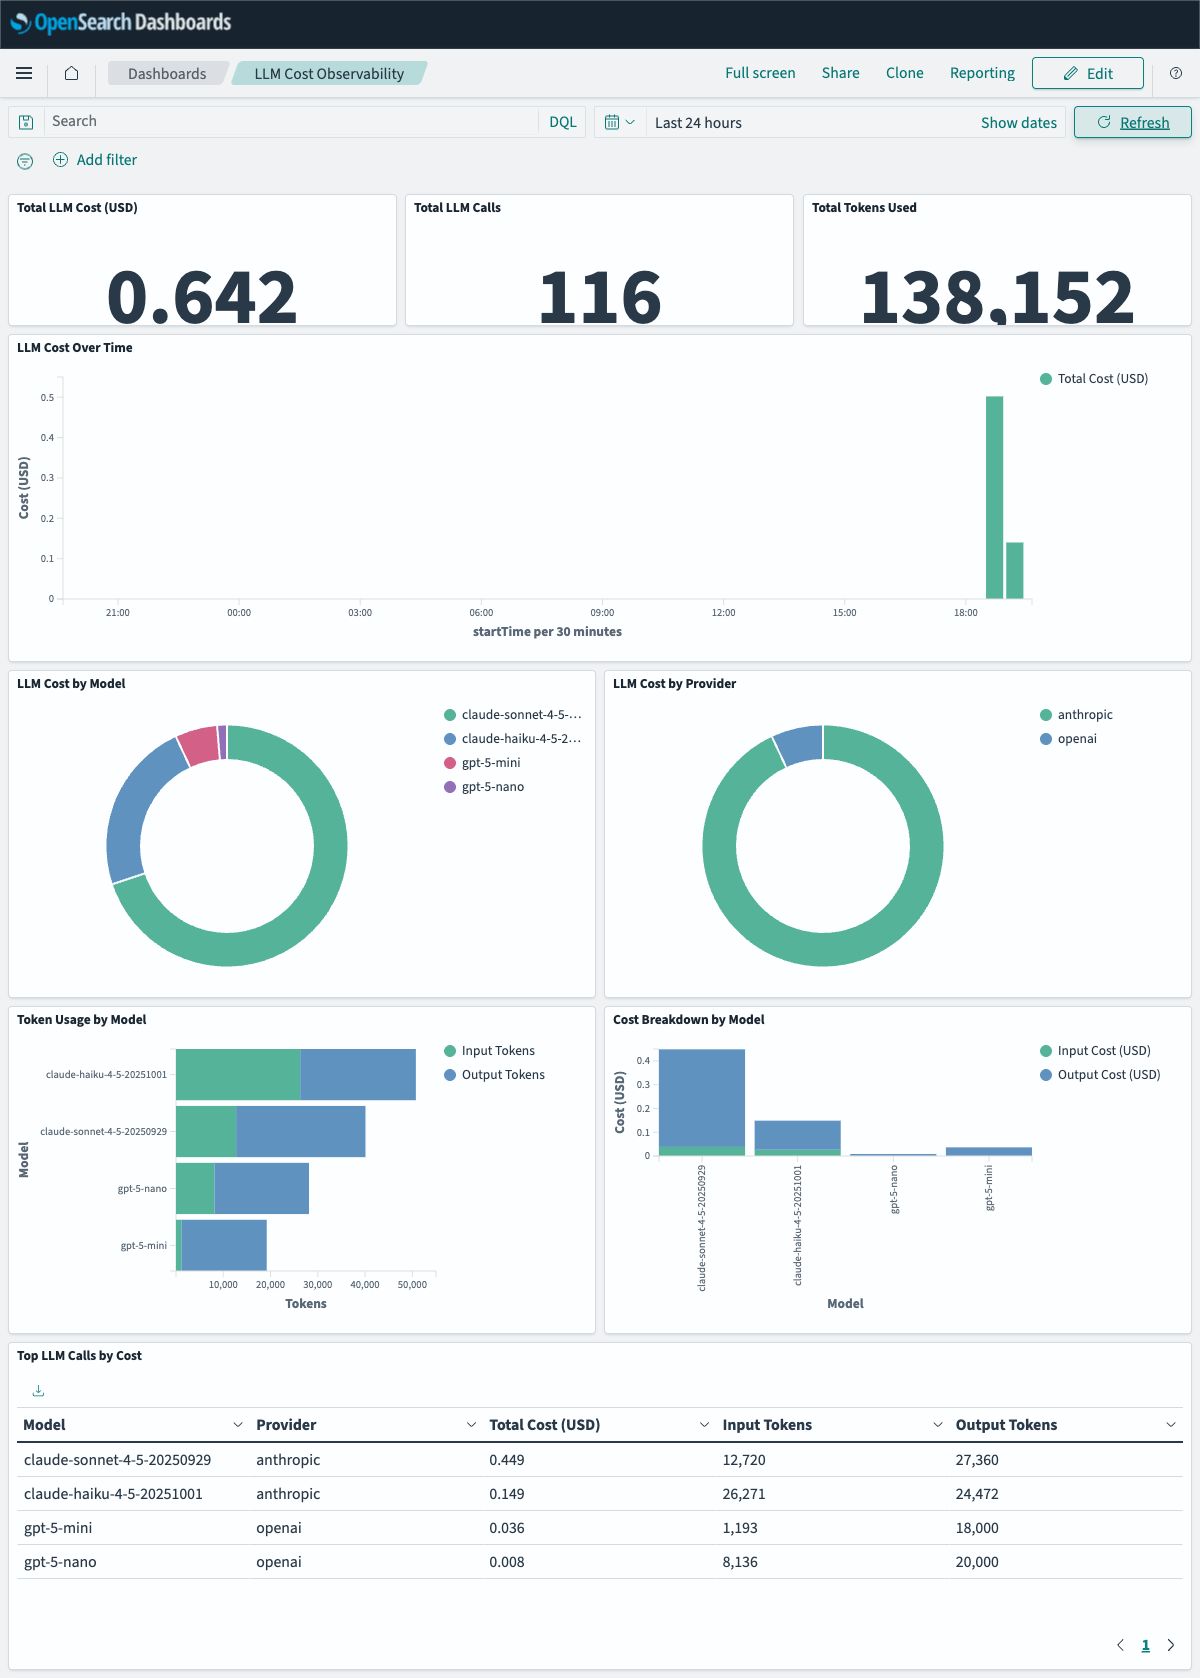
The dashboard is organized in three rows:
Row 1, Cost Overview:
- Total Cost (USD): Metric tile showing aggregate spend across all LLM calls
- Total LLM Calls: Call count
- Cost Distribution by Model: Donut chart showing what percentage of your total spend goes to each model
Row 2, Token & Call Breakdown:
- Cost over Time: Line chart tracking spending trends per model
- Total Input + Output Tokens by Model: Stacked bar comparing token consumption across providers
- Top Expensive Calls: Ranked table of individual calls by cost, with model, provider, and token counts
Row 3, Provider Deep-Dive:
- Cost by Provider: Donut chart — OpenAI vs Anthropic split
- Total Tokens by Provider: Stacked token comparison by provider
- Calls by Provider: Call volume split
The dashboard is defined as an OpenSearch Dashboards saved objects file in NDJSON format. To import it:
| |
Dashboard definition:
dashboards/llm-cost-dashboard.ndjson
How to build or modify panels (field names that matter)
Because Data Prepper replaces . with @ in all span attribute keys, your token/cost fields will look like:
span.attributes.gen_ai@cost@total_usd(type:float)span.attributes.gen_ai@cost@input_usd(type:float)span.attributes.gen_ai@cost@output_usd(type:float)span.attributes.gen_ai@usage@input_tokens(type:long)span.attributes.gen_ai@usage@output_tokens(type:long)span.attributes.gen_ai@request@model(type:keyword)span.attributes.gen_ai@system(type:keyword)
OpenSearch stores span duration as durationInNanos.
Example aggregations:
- Total cost =
sum(span.attributes.gen_ai@cost@total_usd) - Avg cost per call =
sum(span.attributes.gen_ai@cost@total_usd)/count() - Total tokens =
sum(span.attributes.gen_ai@usage@input_tokens)+sum(span.attributes.gen_ai@usage@output_tokens)
If your field names differ, open any LLM span in Trace Analytics → Span detail and look at the attributes directly.
8. Going Further: Automatic Cost Tracking
The gap that motivated the most interesting piece of engineering in this project: OpenLLMetry captures tokens but not dollar cost. It knows you used 500 input tokens and 1200 output tokens on claude-sonnet-4-5-20250929, but it doesn’t know what that costs.
The Architecture
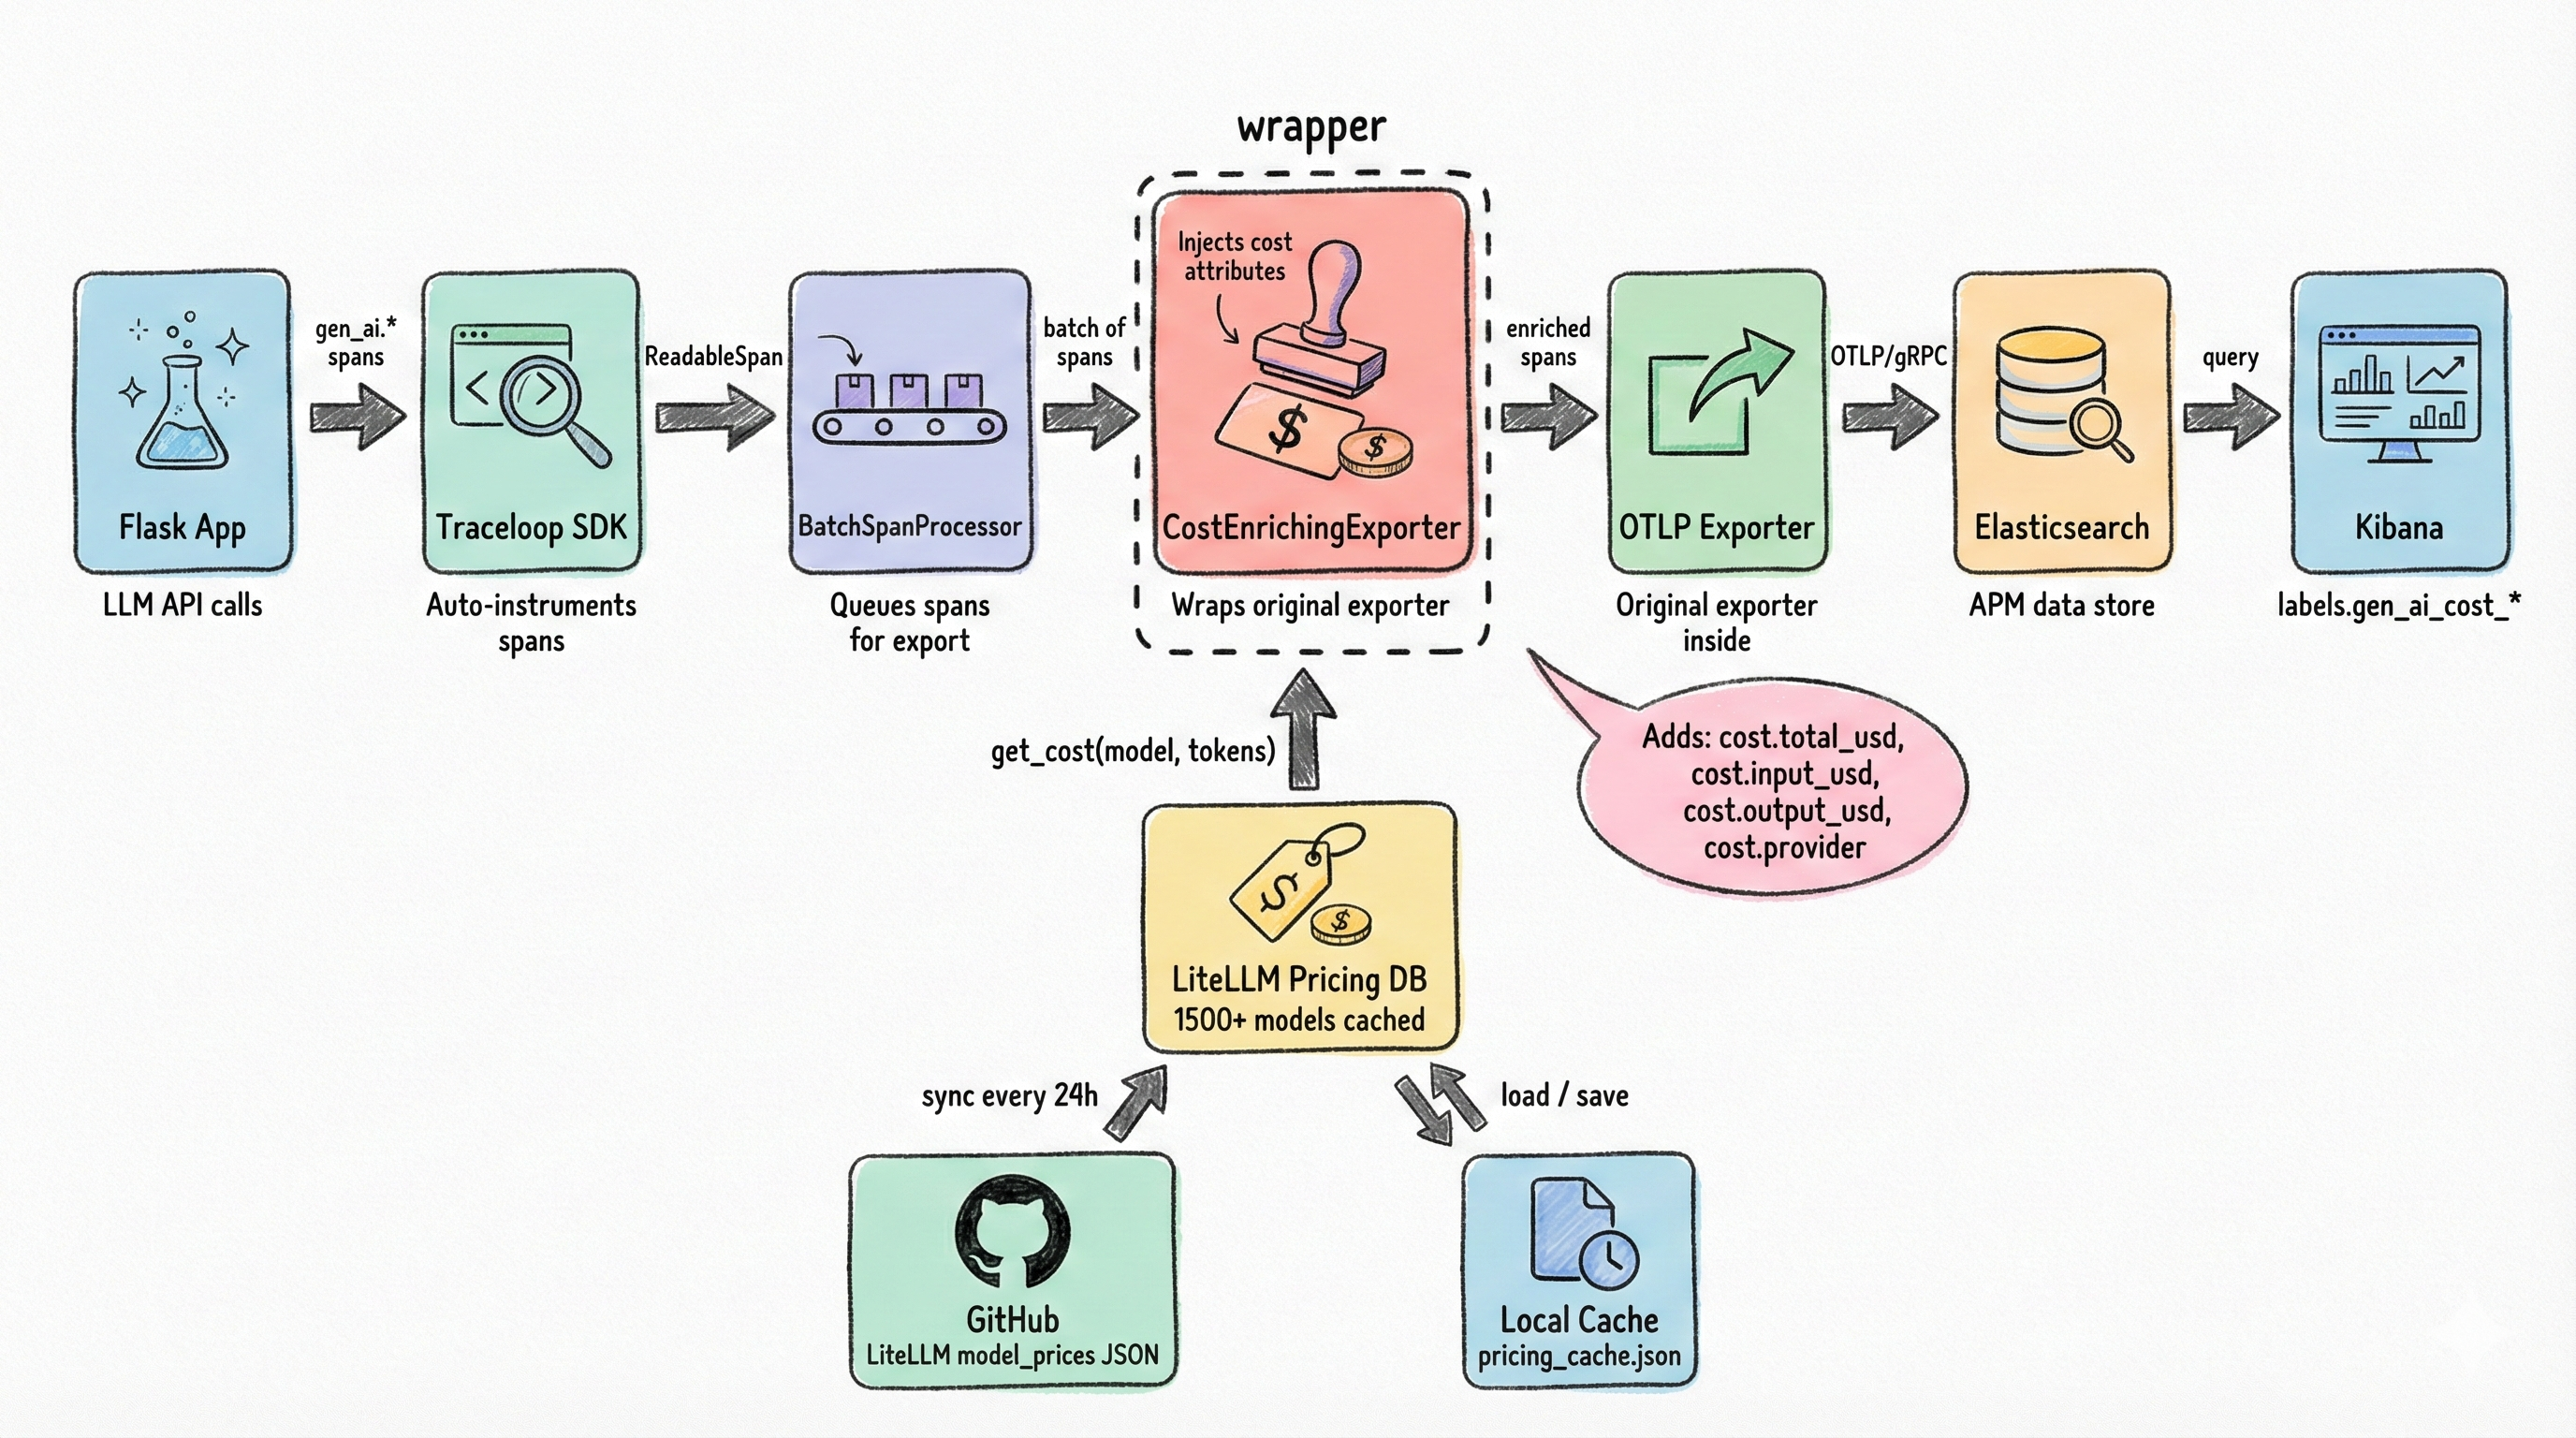
The solution is a custom CostEnrichingSpanExporter that wraps the real OTLP exporter, intercepting the export pipeline to inject cost attributes into LLM spans before they’re sent to the backend. It works by mutating span._attributes in-place, not a public API and therefore upgrade-fragile. I’m using it here to keep the demo small; for production, prefer emitting token/cost metrics via a separate OTel meter or enriching attributes before spans become read-only. If you do use this approach, pin your opentelemetry-sdk version and test after upgrades.
How It Works
The CostEnrichingSpanExporter implements the SpanExporter interface and wraps the original exporter:
| |
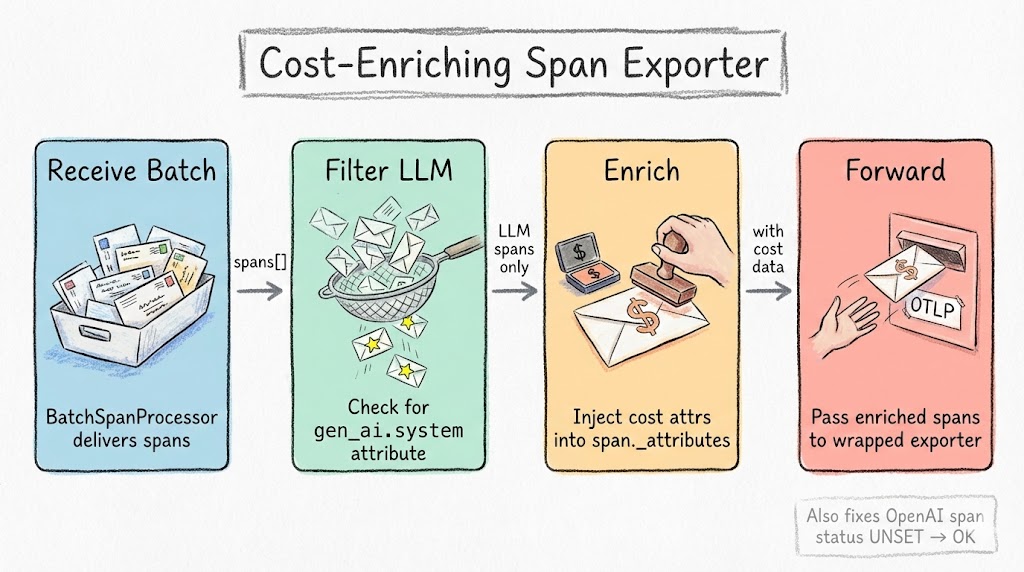
When export() is called by the BatchSpanProcessor, the wrapper:
- Filters for LLM spans (those with
gen_ai.systemattribute) - Extracts model name and token counts from existing span attributes
- Looks up per-token pricing from the database
- Calculates
gen_ai.cost.input_usd,gen_ai.cost.output_usd, andgen_ai.cost.total_usd - Injects the cost attributes into the span — before it is sent to the OTel Collector
- Forwards everything to the wrapped exporter
Non-LLM spans pass through untouched. Negligible overhead.
This is the key advantage of injecting cost client-side (in the Flask process, before the span leaves): it works with any backend. The OTLP payload that arrives at Data Prepper already contains gen_ai.cost.* attributes alongside the token counts. No server-side enrichment required.
Cost math vs invoice reality: Token-based estimates can differ from provider billing due to system prompts, tool calls, cached tokens, rounding, tiered pricing, or provider-side adjustments. Treat this as an allocation and monitoring signal, not a perfect invoice replica.
Production alternative (OTel SpanProcessor): Instead of mutating read-only spans in the exporter, inject cost at span creation via a custom
SpanProcessor. Theon_endhook receives writable spans:
1 2 3 4 5 6 7 8 9 10 11class CostEnrichingSpanProcessor(SpanProcessor): def on_end(self, span: ReadableSpan) -> None: if 'gen_ai.system' in span.attributes: cost = self.pricing_db.get_cost( span.attributes.get('gen_ai.response.model'), span.attributes.get('gen_ai.usage.input_tokens', 0), span.attributes.get('gen_ai.usage.output_tokens', 0), ) self.cost_counter.add(cost['gen_ai.cost.total_usd'], { 'model': span.attributes.get('gen_ai.response.model', 'unknown') })This avoids private API dependencies and works with any OTel backend. The demo repo uses the exporter approach for simplicity. See
app/llm_cost_injector.pyfor the full implementation.
The Pricing Database
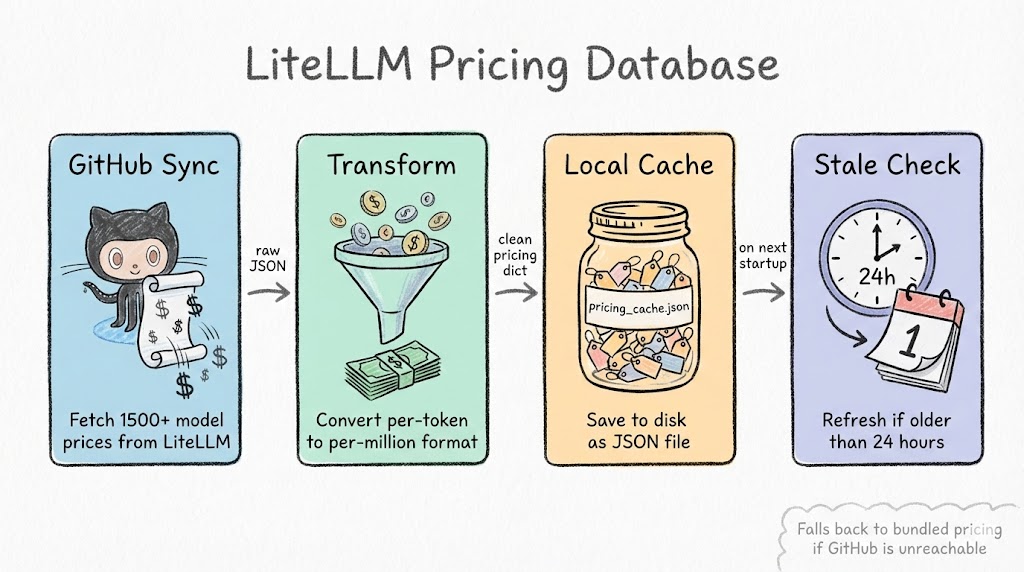
Where do we get pricing data for hundreds of models? From LiteLLM’s open-source pricing database. It’s a JSON file on GitHub with per-token pricing for every major provider: OpenAI, Anthropic, Google, Mistral, Cohere, and more.
The LiteLLMPricingDatabase class:
- Syncs from GitHub on first startup
- Caches locally to avoid network calls on subsequent starts
- Auto-refreshes when the cache is older than 24 hours
- Fuzzy matches model names:
gpt-4o-2024-08-06resolves togpt-4o, provider prefixes likeopenai/gpt-4oare stripped automatically
Wiring It Up
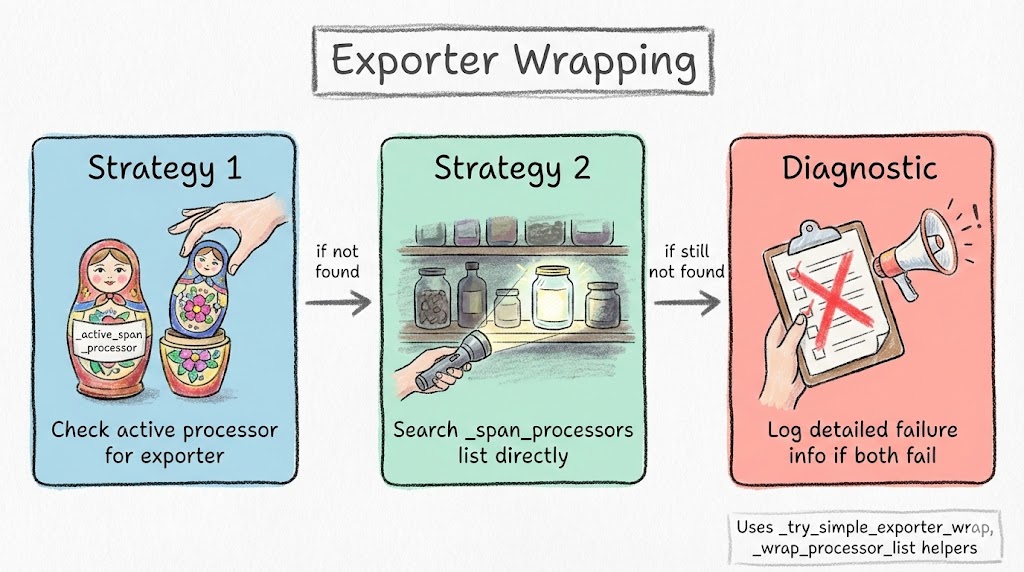
The tricky part is finding and wrapping the exporter inside Traceloop’s OpenTelemetry configuration. Different versions of the SDK organize their span processors differently, so the inject_llm_cost_tracking() function tries multiple strategies:
- Direct exporter wrapping: Find the
BatchSpanProcessor, extract its exporter, wrap it withCostEnrichingSpanExporter, create a new processor - Composite processor traversal: If Traceloop uses a composite processor with multiple children, iterate and wrap each
BatchSpanProcessor - Attribute-based discovery: Check
_active_span_processor,_span_processors, and other internal attributes
The bootstrap is simple. Two lines after Traceloop.init():
| |
After this, every LLM span automatically includes cost data. In OpenSearch, the attributes appear as (after make template runs — more on that next):
span.attributes.gen_ai@cost@total_usd(float)span.attributes.gen_ai@cost@input_usd(float)span.attributes.gen_ai@cost@output_usd(float)span.attributes.gen_ai@cost@provider(keyword)span.attributes.gen_ai@cost@model_resolved(keyword)
Full source:
app/llm_cost_injector.py
9. The One Setup Step You Cannot Skip
This is where the OpenSearch path diverges from other backends, and where the dashboard cost panels show either zeros or error badges if you miss it.
Here is what happens with no extra configuration:
- Data Prepper starts and its ISM (Index State Management) automatically creates
otel-v1-apm-span-000001before any spans arrive. - Data Prepper ships with a legacy index template that contains a catch-all dynamic rule:
1{ "path_match": "span.attributes.*", "mapping": { "type": "keyword" } } - The first LLM span arrives.
gen_ai@cost@total_usdhits this rule and gets indexed askeyword. - OpenSearch Dashboards tries to run a Sum aggregation on a
keywordfield. It fails. The cost panel shows0or “Saved field is invalid for use with the Sum aggregation.”
The fix is a direct PUT /_mapping on the empty index, applied before any span is indexed. Explicit property mappings always win over dynamic template rules within the same index:
| |
Two things to notice:
- Float and long for numeric fields — so Sum and Avg aggregations work.
- Keyword for string fields — so Terms aggregations work. Without this, Data Prepper’s dynamic rule maps string attributes as
text, and OpenSearch Dashboards Terms aggregations require a directly aggregatablekeywordfield.
The timing constraint: this must run on an empty index. Once a field has been indexed as keyword, you cannot change its type in-place. The only recovery is to delete the index and recreate it.
Why not just use an index template?
The obvious approach is to create a composable index template (_index_template) at a high priority that explicitly defines these fields as float and long. I did this. It didn’t work.
In OpenSearch 2.17.1, composable index templates (_index_template API) do not reliably override explicit property definitions from legacy _template dynamic rules for fields that haven’t been seen yet. When the first document arrives with gen_ai@cost@total_usd, the legacy template’s dynamic rule fires and the field is created as keyword. The composable template’s priority-200 explicit float definition loses.
Verified by checking the actual mapping after one span:
| |
Priority 200 composable template, correct field definitions, still keyword. Direct PUT /_mapping is the only approach that works reliably in this version.
Data Prepper creates the index before your setup script runs
There’s one more timing wrinkle: Data Prepper’s ISM creates otel-v1-apm-span-000001 on startup, not when the first span arrives. The index exists within 30 seconds of docker compose up, before any test traffic, before any setup script runs.
This means a setup script that checks for the index, finds it missing, and assumes “template will apply when Data Prepper creates it” is wrong. By the time the script runs that check, the index already exists with the wrong default mapping.
The make template script in the repo handles this correctly: it polls for the index to exist, then immediately applies the explicit field mappings. If it detects the index already has incorrect types (you ran make test before make template by mistake), it self-heals: deletes the index, restarts the data-prepper container so ISM recreates it, then applies the correct mappings to the fresh empty index.
The complete field name translation table
For reference: OTel attribute → Data Prepper field name → required type for OSD aggregations:
| OTel Attribute | OpenSearch Field | Type | OSD Aggregation |
|---|---|---|---|
gen_ai.cost.total_usd | span.attributes.gen_ai@cost@total_usd | float | Sum |
gen_ai.cost.input_usd | span.attributes.gen_ai@cost@input_usd | float | Sum |
gen_ai.cost.output_usd | span.attributes.gen_ai@cost@output_usd | float | Sum |
gen_ai.usage.input_tokens | span.attributes.gen_ai@usage@input_tokens | long | Sum |
gen_ai.usage.output_tokens | span.attributes.gen_ai@usage@output_tokens | long | Sum |
gen_ai.usage.total_tokens | span.attributes.gen_ai@usage@total_tokens | long | Sum |
gen_ai.system | span.attributes.gen_ai@system | keyword | Terms |
gen_ai.request.model | span.attributes.gen_ai@request@model | keyword | Terms |
gen_ai.response.model | span.attributes.gen_ai@response@model | keyword | Terms |
10. Getting Started
Everything below is in the companion repo. The repo README has the most up-to-date quickstart and troubleshooting steps.
Prerequisites
- Docker and Docker Compose
- Python 3.11+
- ~4GB RAM available for Docker
- OpenAI API key
- Anthropic API key
Quick Start
| |
Order matters: make template must run after make up but before make test. If you run make test first by accident, run make template anyway — it will self-heal.
Generate Test Data
| |
Verify in OpenSearch Dashboards
Open the LLM Cost dashboard directly — the time range is pre-set to the last 3 days:
http://localhost:5601/app/dashboards#/view/llm-cost-dashboard?_g=(filters:!(),refreshInterval:(pause:!t,value:0),time:(from:now-3d,to:now))
You should see all 9 panels populated: total cost, call count, cost over time, cost by model, cost by provider, token usage by model, cost breakdown by model, and the top expensive calls table.
Verify cost data is present
| |
Or manually:
| |
Conclusion
The entire stack runs locally in Docker Compose for development. The same architecture scales to production with Amazon OpenSearch Service and Amazon OpenSearch Ingestion (the managed version of Data Prepper), with no changes to your application instrumentation. Because every component speaks OTLP, you can also swap OpenSearch out entirely without touching your application code.
The cost enrichment layer is the most opinionated piece. The demo uses a span exporter wrapper that mutates private attributes — good enough for local development, but for production, move to a SpanProcessor or emit cost as a separate OTel metric (see Section 8).
The field mapping step (Section 9) is the one OpenSearch-specific wrinkle in this stack. Once you understand that Data Prepper renames . to @ and that explicit index mappings must be applied before the first span arrives, everything else falls into place.
Check out the full source code on GitHub. Star it if you find it useful.